
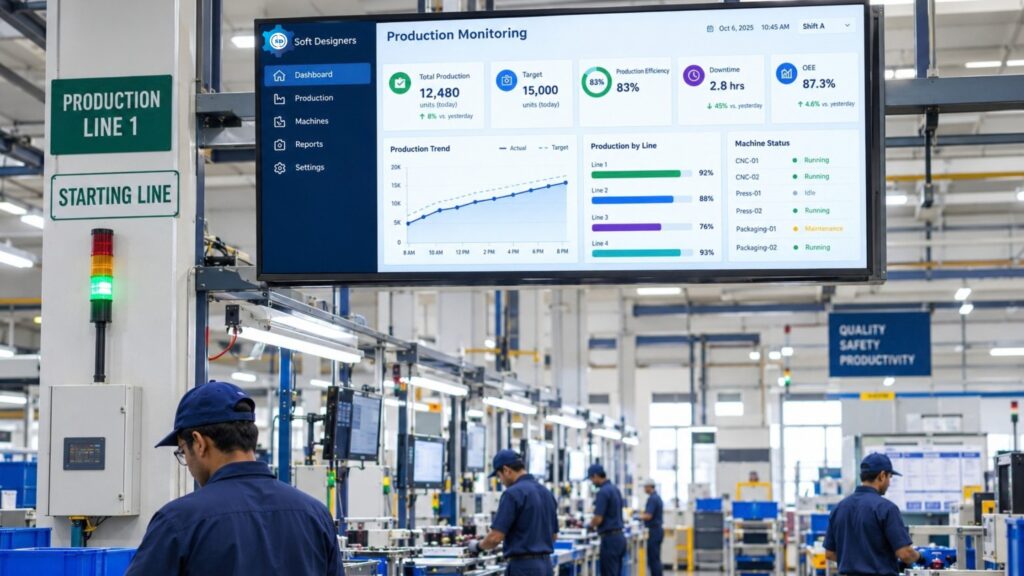
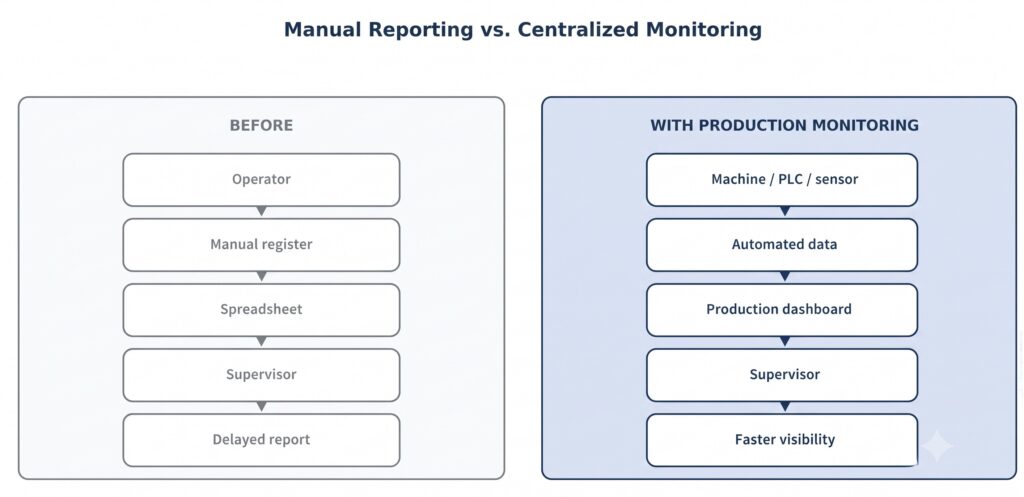
Manual production registers, spreadsheet reports, and end-of-shift summaries share one weakness, the information arrives after the loss has happened. Operator-dependent updates, machines that report data differently, and delayed management reports make the real condition of a line hard to see. Production Monitoring Software transforms this process by automatically capturing machine and production data and bringing all the information together within a centralized system.
Production output, machine status, downtime, quality, Overall Equipment Effectiveness (OEE), production targets, and production efficiency can then be viewed while work is still in progress. Historical records also become usable instead of sitting in old registers, and supervisors no longer have to chase operators for numbers before a review meeting. Decisions then rest on current information rather than on last shift’s summary.
This article looks at the specific shop-floor problems that production monitoring helps manufacturing teams identify, understand, and respond to, and at the information that makes action possible.
What Are the Common Production Monitoring Problems on the Shop Floor?
Most plants deal with a familiar set: delayed production information, unclear planned versus actual output, unplanned downtime, recurring machine faults, low machine utilization, inaccurate manual data, mixed machine types, slow response to interruptions, limited traceability, schedule deviations, weak line balance, and disconnected records.
These problems feed each other. Delayed information hides target deviations. Poor downtime data makes optimization guesswork. Uneven machine performance creates line-balancing problems. Disconnected data slows corrective action. Treating them as one connected picture is more practical than fixing each in isolation.
1. Delayed Visibility Into Production Performance
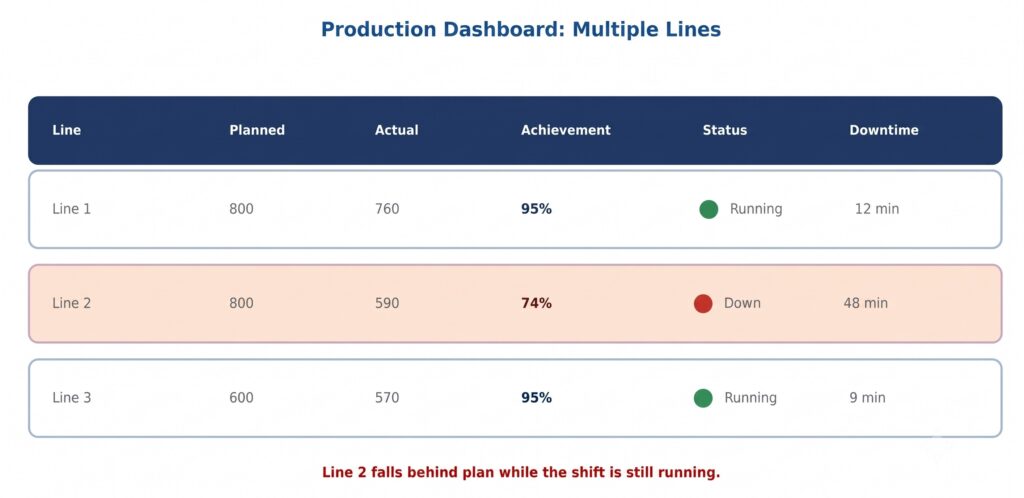
Registers, spreadsheets, end-of-shift reports, and verbal updates all describe the past. By the time a supervisor reads them, the shift is over. Real-time production monitoring shows live status at machine and line level, so gaps appear while the shift is still running. Centralized information also means the same numbers reach the operator, the supervisor, and the plant manager at the same time.
Example: A line runs below its expected rate during the second half of a shift. Live output exposes the gap early enough for the team to check whether downtime, slow cycles, or a material shortage is responsible.
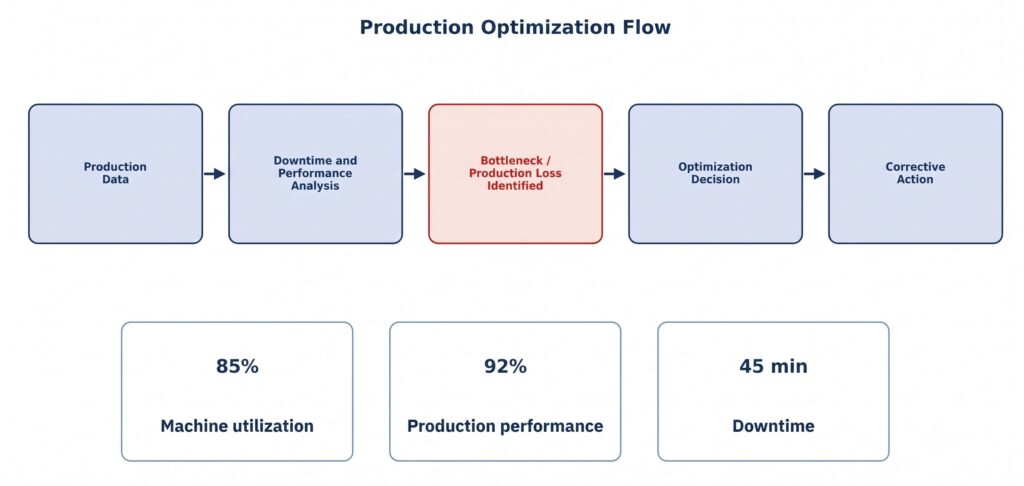
A problem typically becomes visible in this order:
- Production activity generates machine data.
- The system collects it.
- The dashboard displays current status.
- A deviation or loss appears.
- The responsible team investigates and acts.
2. Difficulty Tracking Production Targets vs. Actual Output
Knowing the target is not enough. Targets exist at several levels: daily, weekly, monthly, shift-wise, production line, and individual machine. Each needs a live comparison with the actual output. For example, a shift target of 1,000 units can look achievable at the start and slip out of reach unnoticed by midday. Weekly and monthly targets add context, since one weak shift reads differently against the wider period.
A machine-level shortfall can then be investigated within the shift rather than explained the next morning.
3. Production Efficiency Monitoring Problems
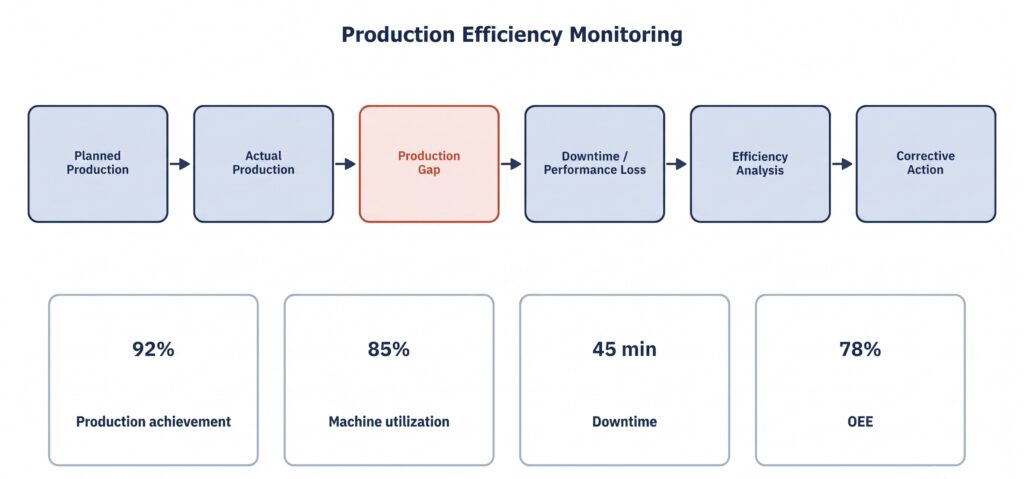
Counting units alone does not explain efficiency. A line can meet its quantity and still lose capacity through underutilized machines, excessive downtime, uneven machine performance, and unnoticed production losses.
Production efficiency monitoring uses production data to show how effectively available resources are used. Actual output is compared with planned production and targets, then read alongside machine utilization, downtime, and OEE. Inefficiency becomes visible where output trails, planned rates or stoppages consume running time. The production team then knows exactly where to investigate, whether that means a specific machine, a shift, or a product.
4. Unplanned Machine Downtime and Hidden Production Losses
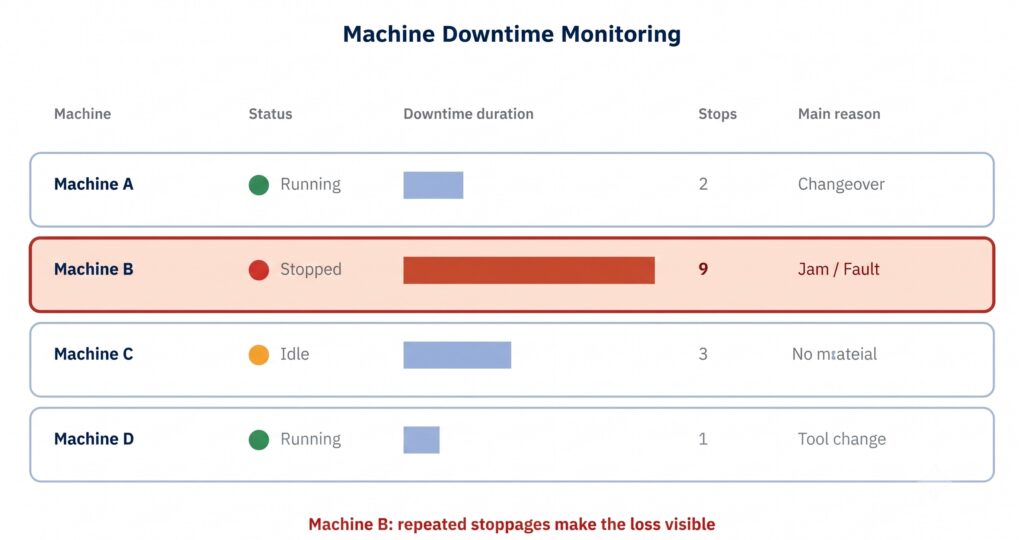
Breakdowns are easy to notice. Short stoppages are not. A minor jam repeated many times in a shift can cost more production than one long breakdown, yet manual records often miss it. Operators busy restarting equipment rarely stop to log a ninety-second interruption, so the loss never reaches a report.
Machine downtime monitoring tracks machine status continuously. Downtime is recorded by machine, line, and shift, along with duration, frequency, reason, and breakdown category.
The useful questions are which machine, when, how long, how often, and why. A note saying a machine stopped answers none of them. With the full pattern visible, maintenance and production can agree on which stoppages deserve attention first.
5. Recurring Machine Problems and Machine Monitoring Sensors
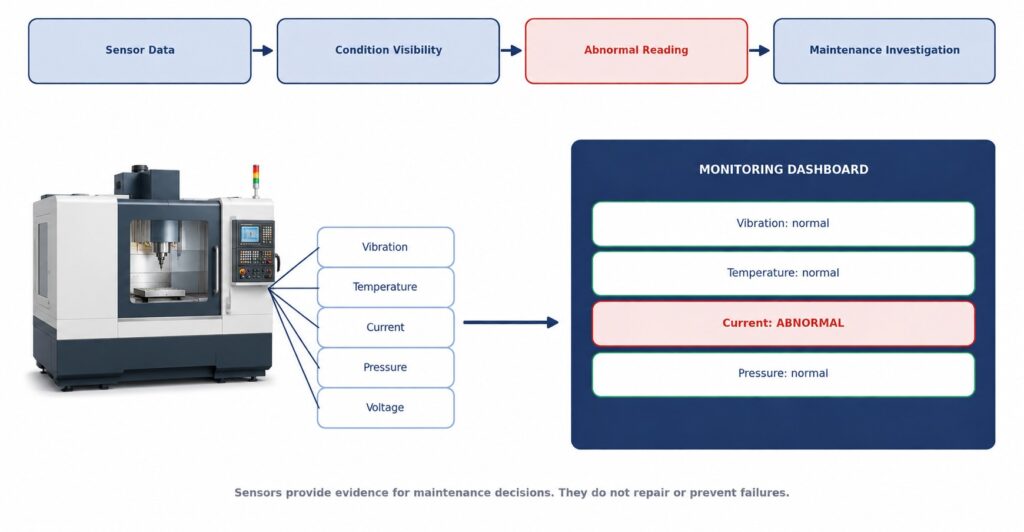
A fault is repaired, and weeks later the same machine stops again. Repeated stoppages, frequently affected machines, and historical downtime patterns suggest the underlying cause has not been resolved. The repair treated the symptom. Downtime history shows which machine keeps returning, and condition data may suggest why.
Machine monitoring sensors add condition information such as vibration, current, temperature, pressure, voltage, and motor condition.
Readings that drift from normal behavior can prompt a maintenance investigation before a stoppage occurs. Sensors do not prevent every failure. Their realistic role is to give maintenance teams additional evidence, supporting a shift from reactive repairs toward condition-based decisions.
6. Poor Understanding of Overall Equipment Effectiveness
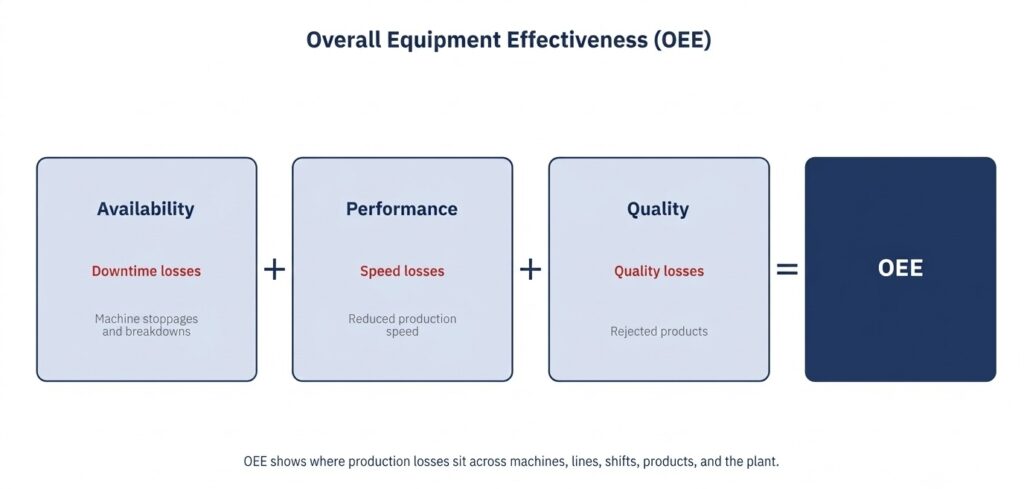
Output alone cannot explain equipment effectiveness. OEE combines availability, performance, and quality. Downtime reduces availability, speed losses reduce performance, and rejects reduce quality.
OEE monitoring can be viewed across machines, lines, shifts, products, and the whole plant. A single percentage then becomes a map showing where production losses sit. Low availability points toward downtime, low performance toward speed losses, and low quality toward rejects. Comparing products or shifts shows whether the loss is tied to a particular setup.
7. Production Scheduling Issues
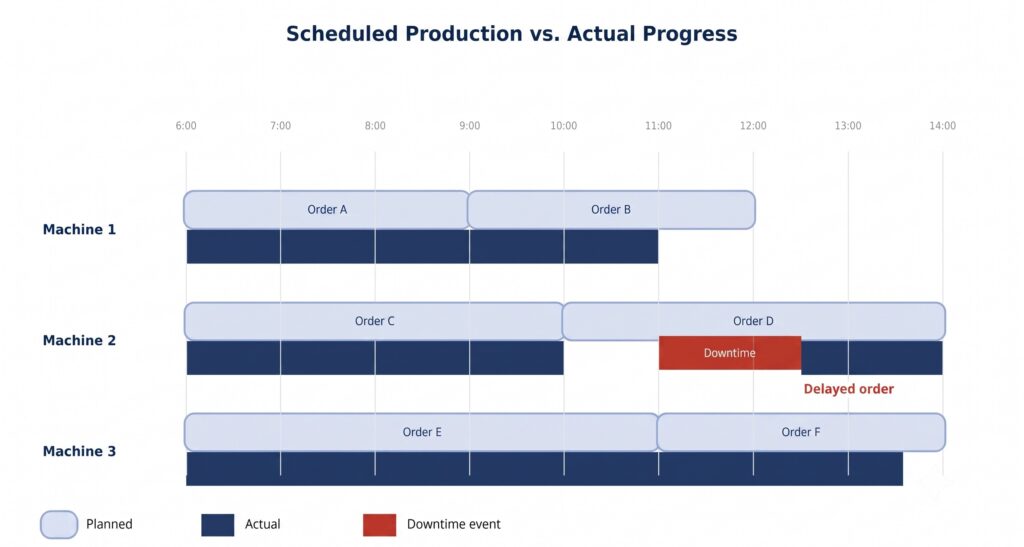
A schedule assumes the plan will be followed. When actual information arrives late, deviations stay hidden: downtime consumes planned time, orders slip, and priorities change without anyone knowing whether scheduled work is progressing.
Live comparison of scheduled and actual progress gives supervisors and planners the visibility to review priorities. It does not replace scheduling tools. It shows early whether a machine interruption is pushing an order behind the plan. Adjustments can then happen while options remain.
8. Production Optimization Issues
Optimization needs evidence. When information is delayed, incomplete, or scattered, repeated losses, underutilized machines, bottlenecks, and repeated interruptions remain unclear.
Monitoring does not optimize a process automatically. It shows production teams where attention is required, so analysis starts from data instead of opinion. Repeated losses, underutilized machines, and recurring interruptions can then be ranked by their actual effect on output.
9. Production Line Balancing Issues
One slow workstation can restrict an entire line. When one operation falls behind, subsequent workstations may remain unproductive, employees are left waiting, and excess material starts accumulating between production stages. Station differences are hard to see by observation alone, and opinions about the slowest station often differ from the numbers.
Idle machines and waiting operators are symptoms, while the restricting station is the actual cause. Machine-level and station-level monitoring places production rates side by side.
The software does not balance the line. It supplies the information behind that decision, showing which station restricts output and by how much, so the review starts with facts.
10. Manual Production Data Collection and Inaccurate Reporting
Registers demand repeated manual data entry, and every entry invites delay or error. Consolidating spreadsheets from several machines takes time and still leaves gaps.
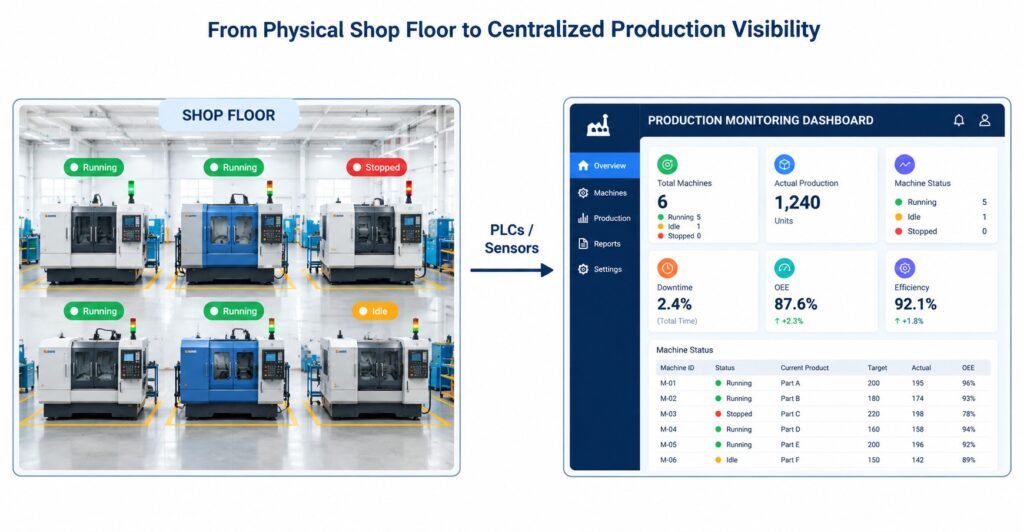
Automated collection can draw data from PLCs, machines, sensors, IoT gateways, barcode scanners, and existing automation systems. Centralized information reduces dependence on manual reporting, and the data reaching management is no longer filtered through several hands.
11. Lack of Visibility Across Manual, Semi-Automatic, and Automatic Machines
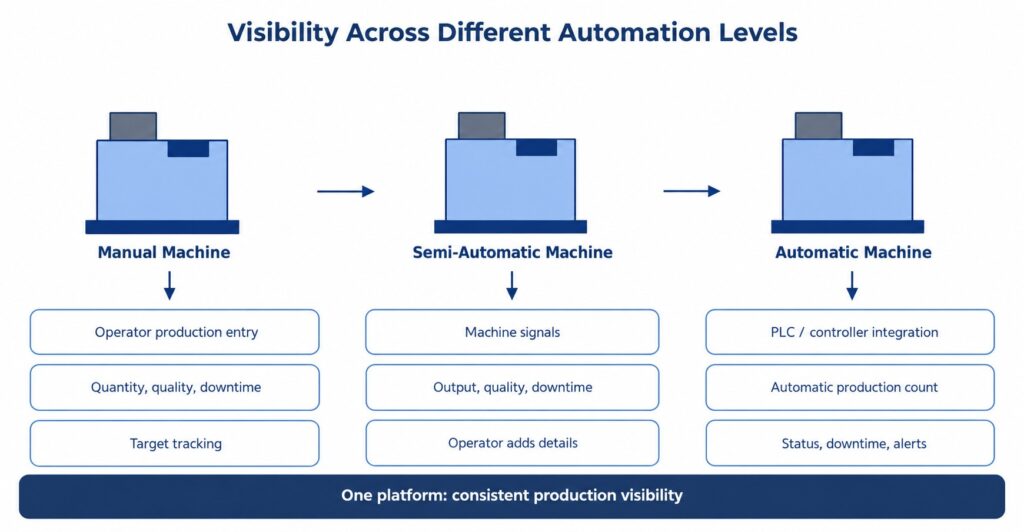
Few plants run entirely uniform equipment, so visibility often splits along automation lines.
- Manual machines: operators record quantity, quality, downtime, and target progress digitally.
- Semi-automatic machines: machine signals supply status, output, quality output, and downtime.
- Automatic machines: PLC or controller integration provides production counts, status, downtime, quality monitoring, and breakdown alerts.
All three feed one platform. Without it, each machine type ends up with its own reporting method, and comparing them becomes difficult.
12. Slow Response to Production Interruptions
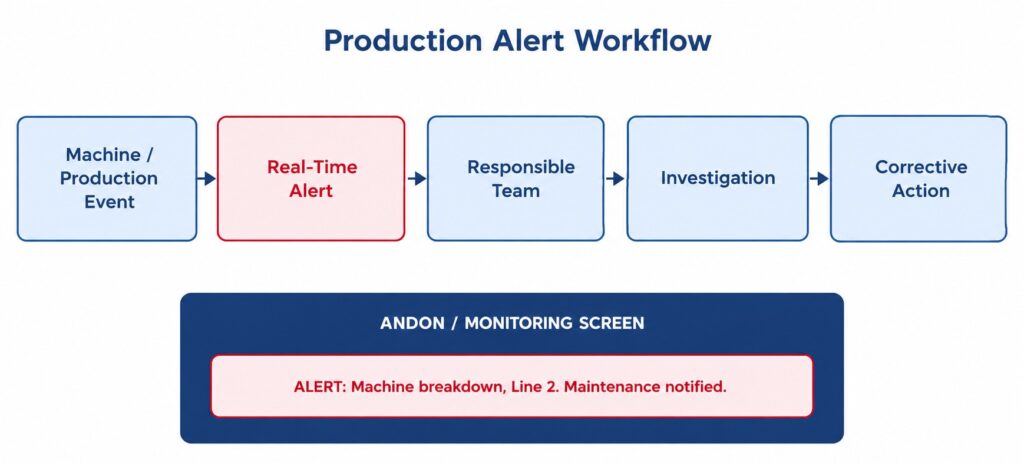
Often the problem is not that nobody knew about a fault, but how long the information took to reach the responsible team. Breakdowns, stoppages, excessive downtime, quality issues, and target deviations all need fast escalation. Andon integration addresses response time by turning a production event into an alert sent to the person responsible, instead of waiting for someone to walk over and report it. A stoppage heard about twenty minutes late has already cost that time.
13. Limited Production Traceability
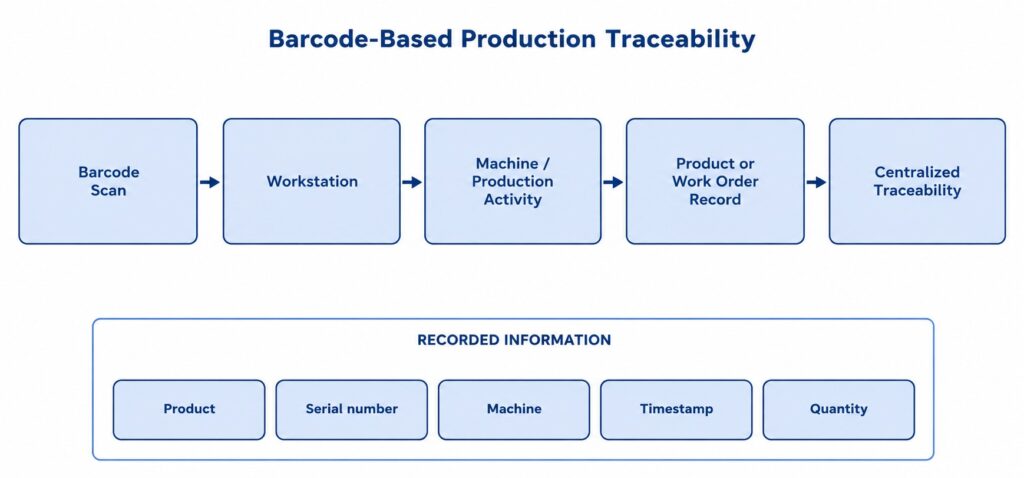
Production records lose value when they are not tied to a product or work order, and tracing a defect back to a station means searching paper records. Barcode scanning can capture serial number, part number, work order, quantity, station, machine, timestamp, and operator. Production data then answers not only how many units were made, but which product, where, when, and by whom. Barcode-based records also link production quantity to the machine and station that produced it.
14. Production Dashboard and Disconnected Production Information
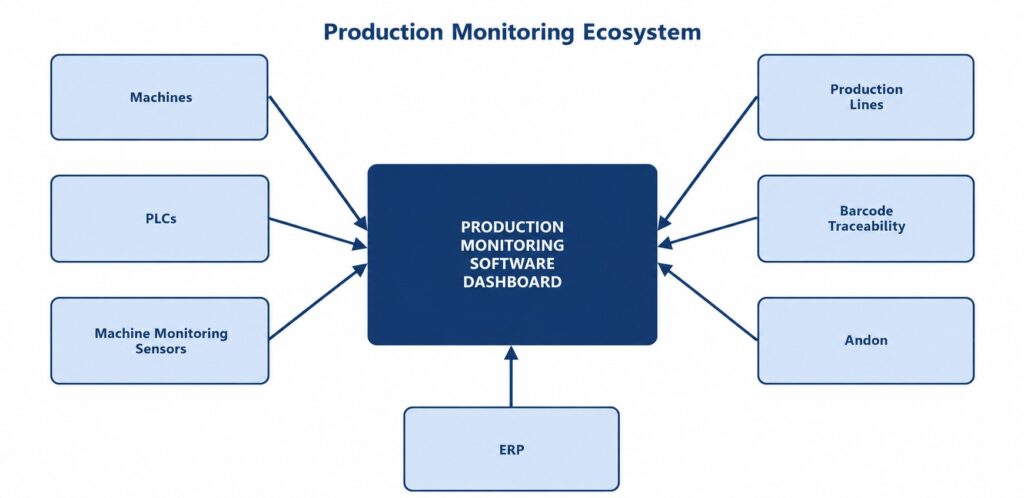
Information often sits in registers, spreadsheets, machine displays, operator reports, ERP, shop-floor systems, traceability systems, and Andon systems. Each source shows only part of the picture, and reconciling them by hand takes time.
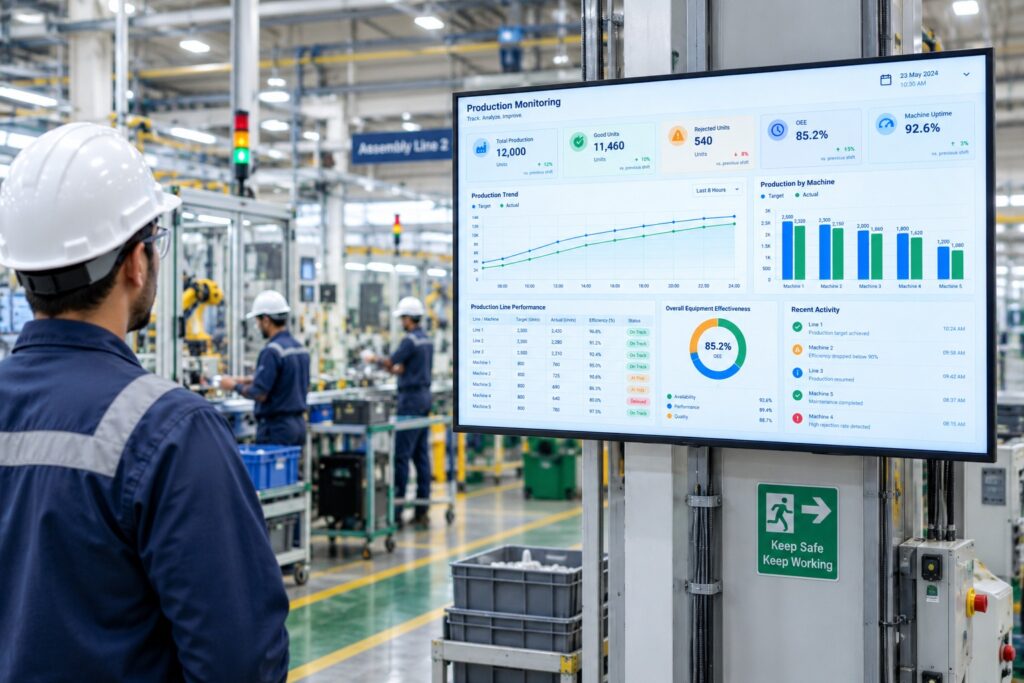
A production dashboard centralizes actual production, targets, machine status, downtime, OEE, efficiency, line performance, quality, alerts, and production losses. Supervisors and managers see relevant information from one view, and a mobile app extends that view beyond the production floor.
Integrations make this possible: PLCs and machine systems, industrial protocols such as OPC UA, Modbus, and PROFINET, ERP, Andon, and barcode traceability.
How Production Monitoring Software Connects Shop-Floor Problems to Action
| Shop-Floor Problem | What the Software Monitors | Resulting Action |
|---|---|---|
| Delayed production information | Real-time output | Identify gaps earlier |
| Target shortfall | Target vs. actual | Investigate deviation |
| Low production efficiency | Performance, downtime, OEE | Identify efficiency losses |
| Scheduling deviation | Planned vs. actual progress | Review production priorities |
| Machine downtime | Duration, frequency, reason | Investigate losses |
| Recurring machine problems | Historical downtime and condition data |
Prioritize maintenance investigation |
| Low equipment effectiveness | OEE | Identify availability, performance, and quality losses |
| Production optimization issue | Production and machine data | Identify areas requiring optimization |
What Should Manufacturers Monitor on the Shop Floor?
Monitoring works best when it is organized around decisions, not screens. Six areas cover most shop-floor needs.
- Production: actual output, targets, achievement, scheduled versus actual progress
- Machines: running status, downtime, breakdowns, machine condition, sensor readings
- Efficiency: production efficiency, OEE, availability, performance, quality
- Line performance: station performance, bottlenecks, production rate
- Quality and traceability: quality output, serial information, timestamps, work orders
- Alerts: breakdowns, stoppages, target deviations, relevant events
Each area should connect to a person who can act on it, whether that is a supervisor, a maintenance lead, or a planner.
Final Takeaway: Turning Shop-Floor Problems Into Real-Time Production Insights
Delayed visibility, target shortfalls, efficiency gaps, scheduling deviations, unplanned downtime, recurring faults, unclear OEE, weak optimization data, unbalanced lines, manual collection, mixed machine types, slow response, limited traceability, and disconnected information share one root cause: the shop floor cannot see itself quickly enough. Each problem looks different, but each begins with information that arrives late, incomplete, or in the wrong place.
Production Monitoring Software provides the information needed to see the problem, understand where the loss is occurring, and support faster corrective action.
Soft Designers helps manufacturers connect manual, semi-automatic, and automatic machines, monitor production in real time, track production efficiency, measure OEE, and improve shop-floor visibility. A demonstration with real machine data is a practical first step.