

SPC Software for Manufacturing
Our SPC Software continuously monitors manufacturing processes using real-time production data and statistical analysis to detect abnormal variation, process instability, and quality deviations. It combines automated data collection, control charts, dashboards, alerts, reporting, and machine connectivity to provide actionable visibility for consistent product quality and process improvement.
SCHEDULE A DEMOSmarter Manufacturing Quality Control with Digital SPC :
Digital SPC brings production data and quality insights into one connected platform, helping teams track process performance as it happens and identify variations before they affect output.
Process Improvement
- Continuously collect production measurements through automated machine and IoT connectivity or manual data entry.
- Evaluate measurements against predefined specifications, tolerances, and statistical control limits.
- Use control charts and statistical analysis to identify unusual patterns, shifts, trends, and process instability.
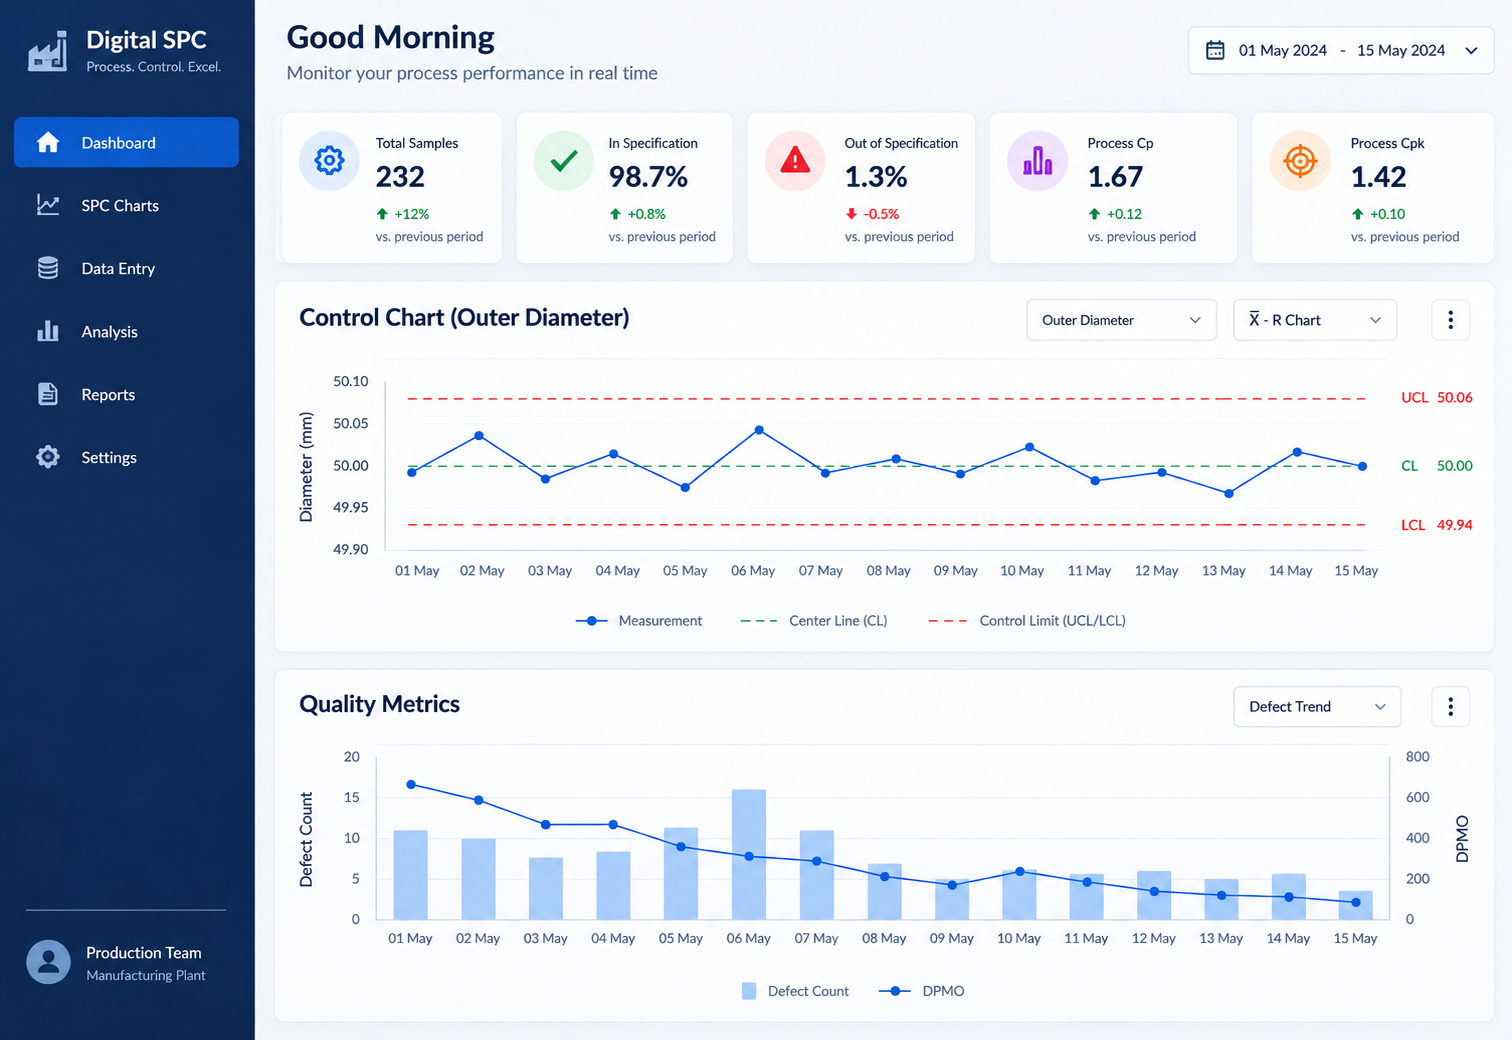
- Monitor process performance across products, machines, processes, and production lines through real-time dashboards.
- Generate deviation alerts, reports, and quality analytics to support timely corrective and preventive action.
Explore Every Control Chart
Monitor process performance, detect variations, and improve manufacturing quality with the right statistical control chart for every process.
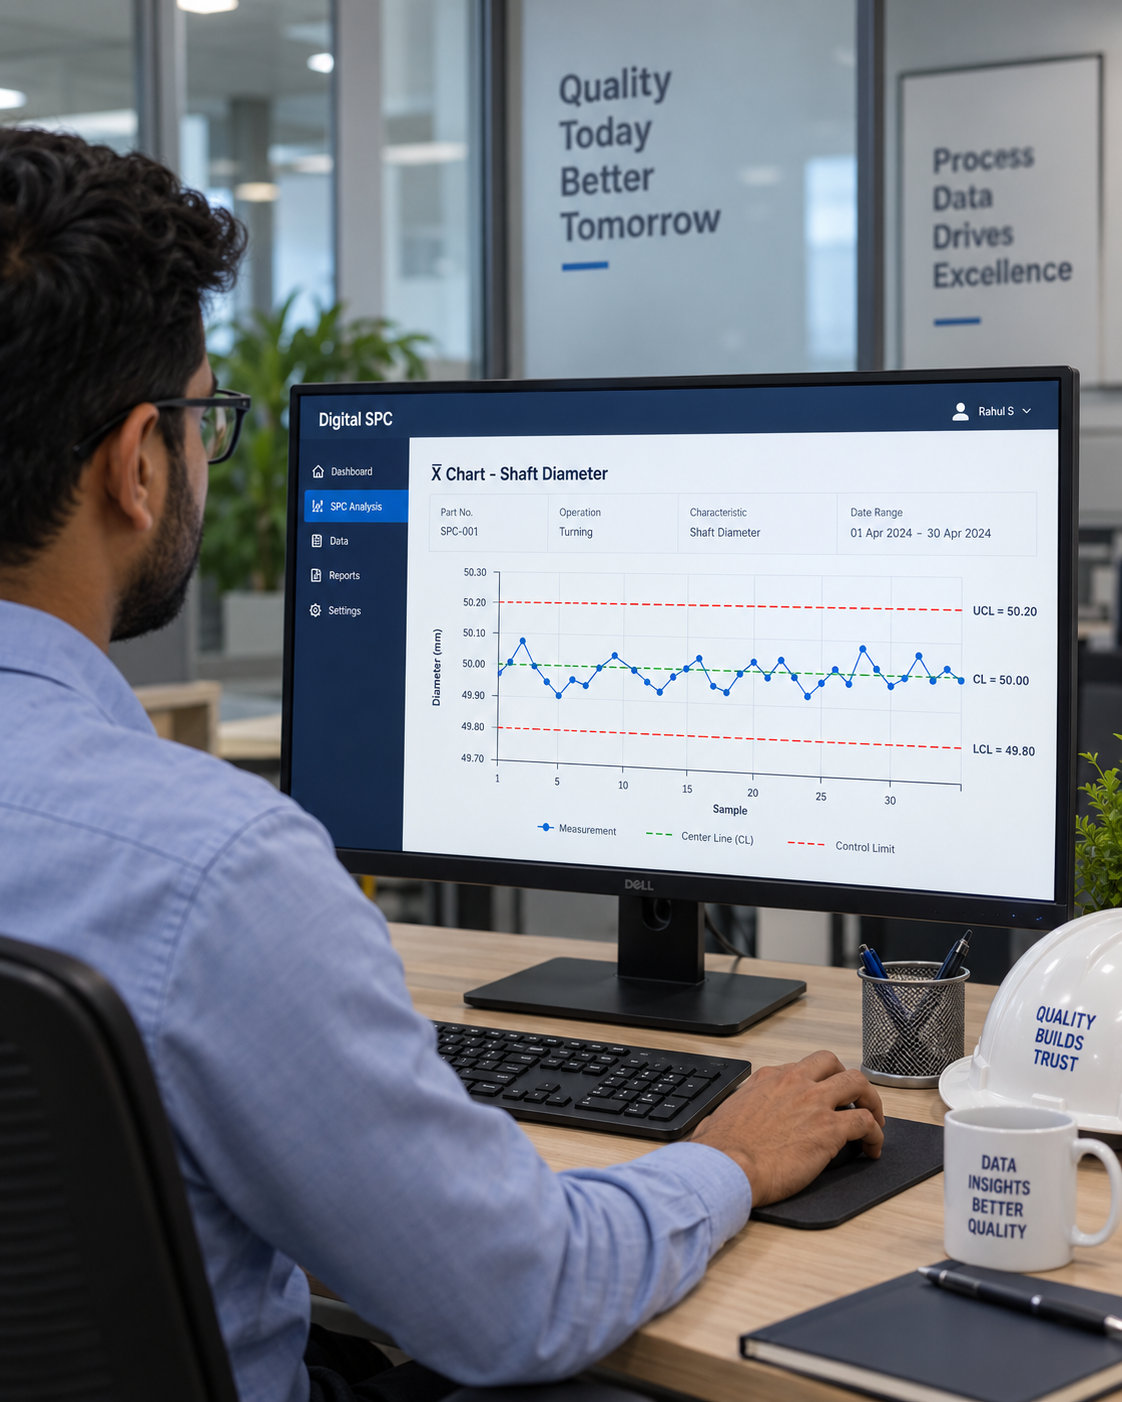
X-Bar Chart
Monitors process averages over time to detect shifts and maintain stable manufacturing performance.
Connected Dashboards for Process Visibility
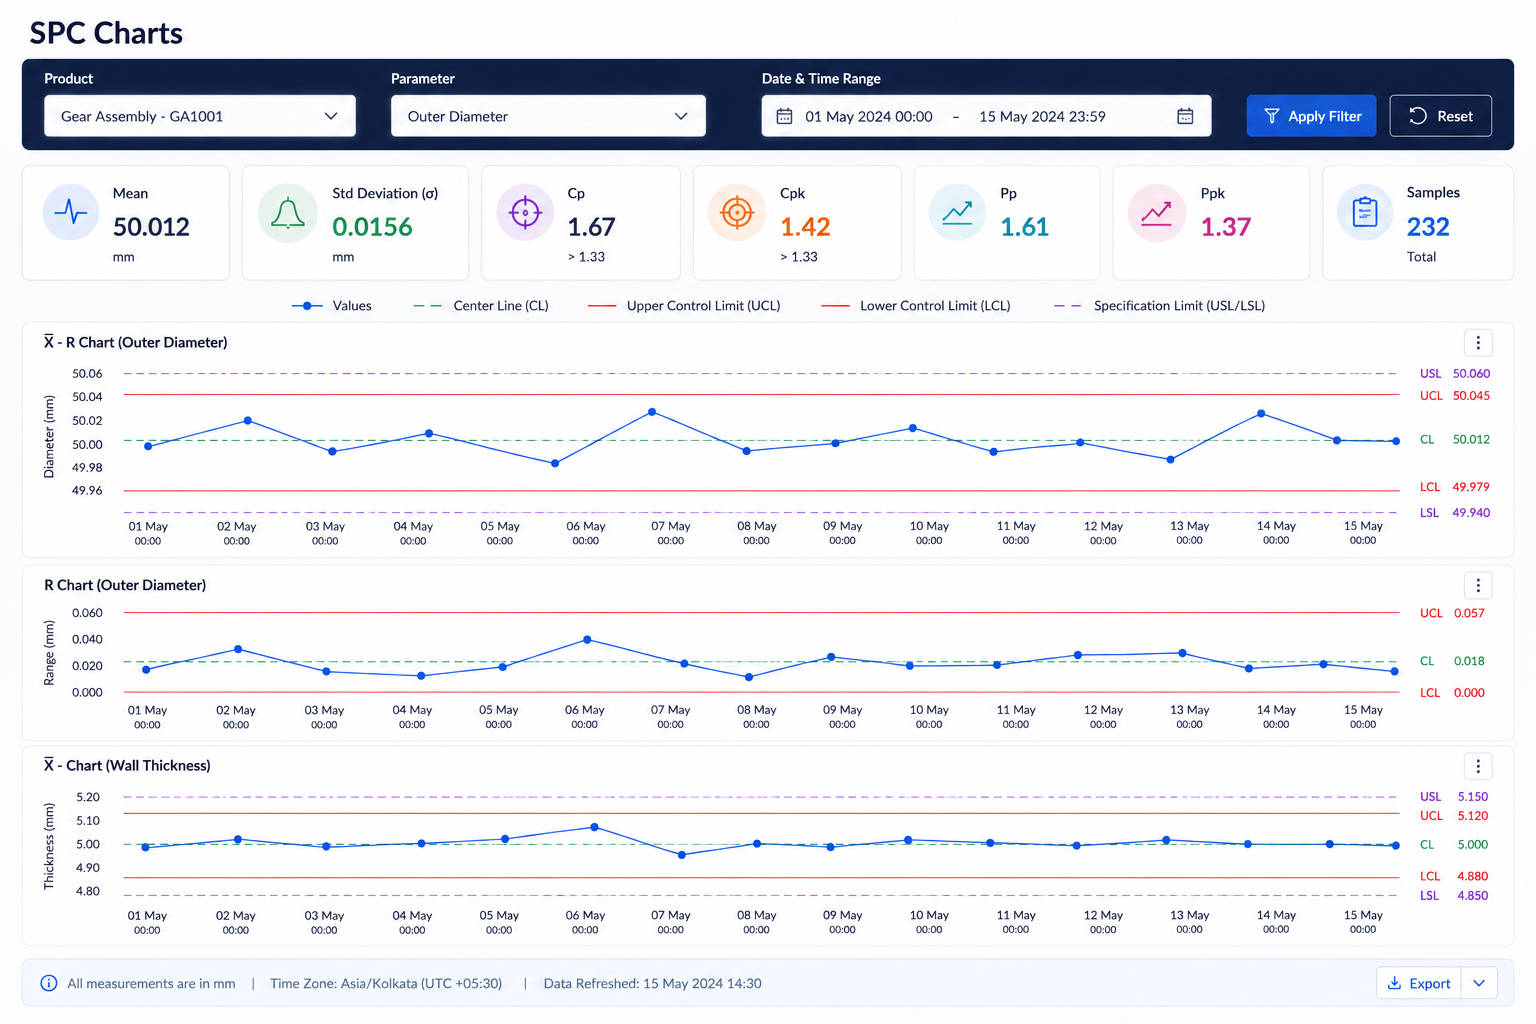
Digital SPC provides centralized dashboards and advanced data filtering to give quality teams clear visibility into process performance, quality deviations, and historical measurements. It helps users quickly find specific process information and identify patterns across production data.
Process Insights
Monitor process performance, variation, control chart status, parameter trends, and quality deviations through centralized dashboards..
Performance Overview
View product performance, machine performance, and historical measurements across the manufacturing operation.
Data Selection
Filter SPC charts and historical measurements by product, part number, parameter, machine, process, and production line.
Condition Analysis
Analyze process data by batch, shift, operator, and date range to investigate specific quality conditions.
Pattern Detection
Identify recurring quality problems and patterns across production data for effective process analysis.
How Digital SPC Works
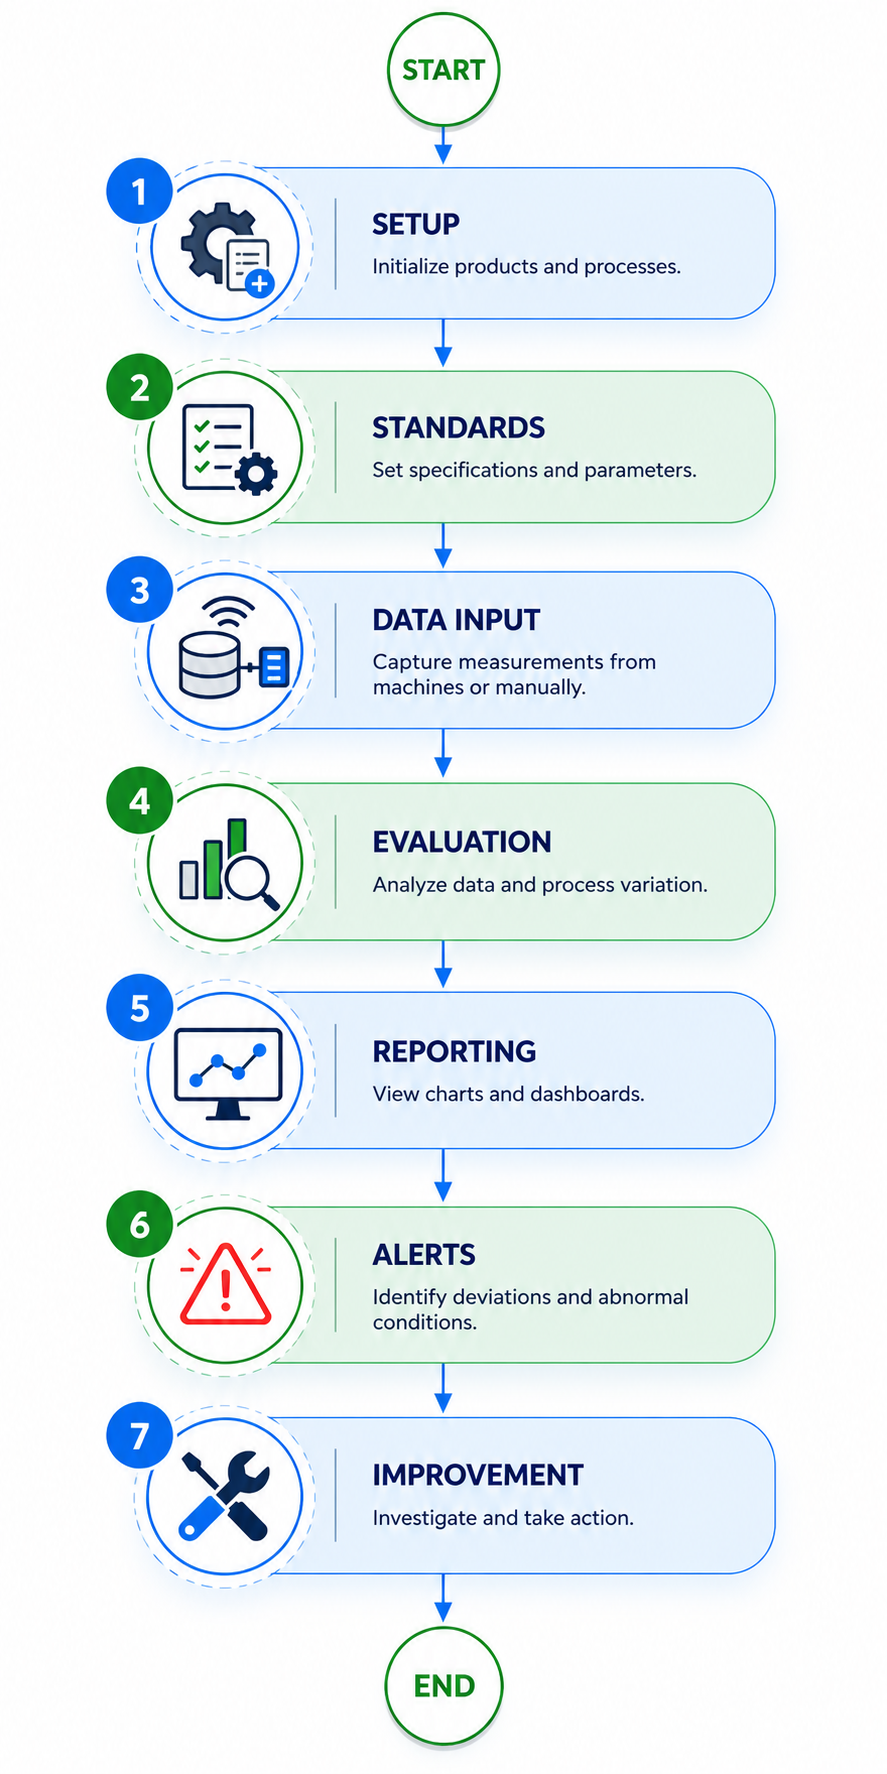
Digital SPC continuously collects manufacturing measurements, evaluates them against predefined specifications and statistical control limits, and analyzes process behavior using statistical methods. It helps quality teams identify abnormal conditions earlier and take corrective action to improve process performance.
Step 1: Configure the Process
Create products, processes, and quality characteristics within the Digital SPC system.
Step 2: Define Quality Requirements
Set specifications and statistical monitoring parameters for each quality characteristic.
Step 3: Collect Measurements
Capture process data manually or directly from connected machines and IoT devices.
Step 4: Analyze Process Behavior
Perform statistical analysis on collected measurements to evaluate process performance and variation.
Step 5: Visualize Results
Display process behavior through control charts, dashboards, and analytical reports.
Step 6: Detect Abnormal Conditions
Identify deviations, unusual variation, and other predefined quality conditions.
Step 7: Take Corrective Action
Use process information to investigate causes and take action to improve process performance.
Automated Equipment & IoT Data Capture :
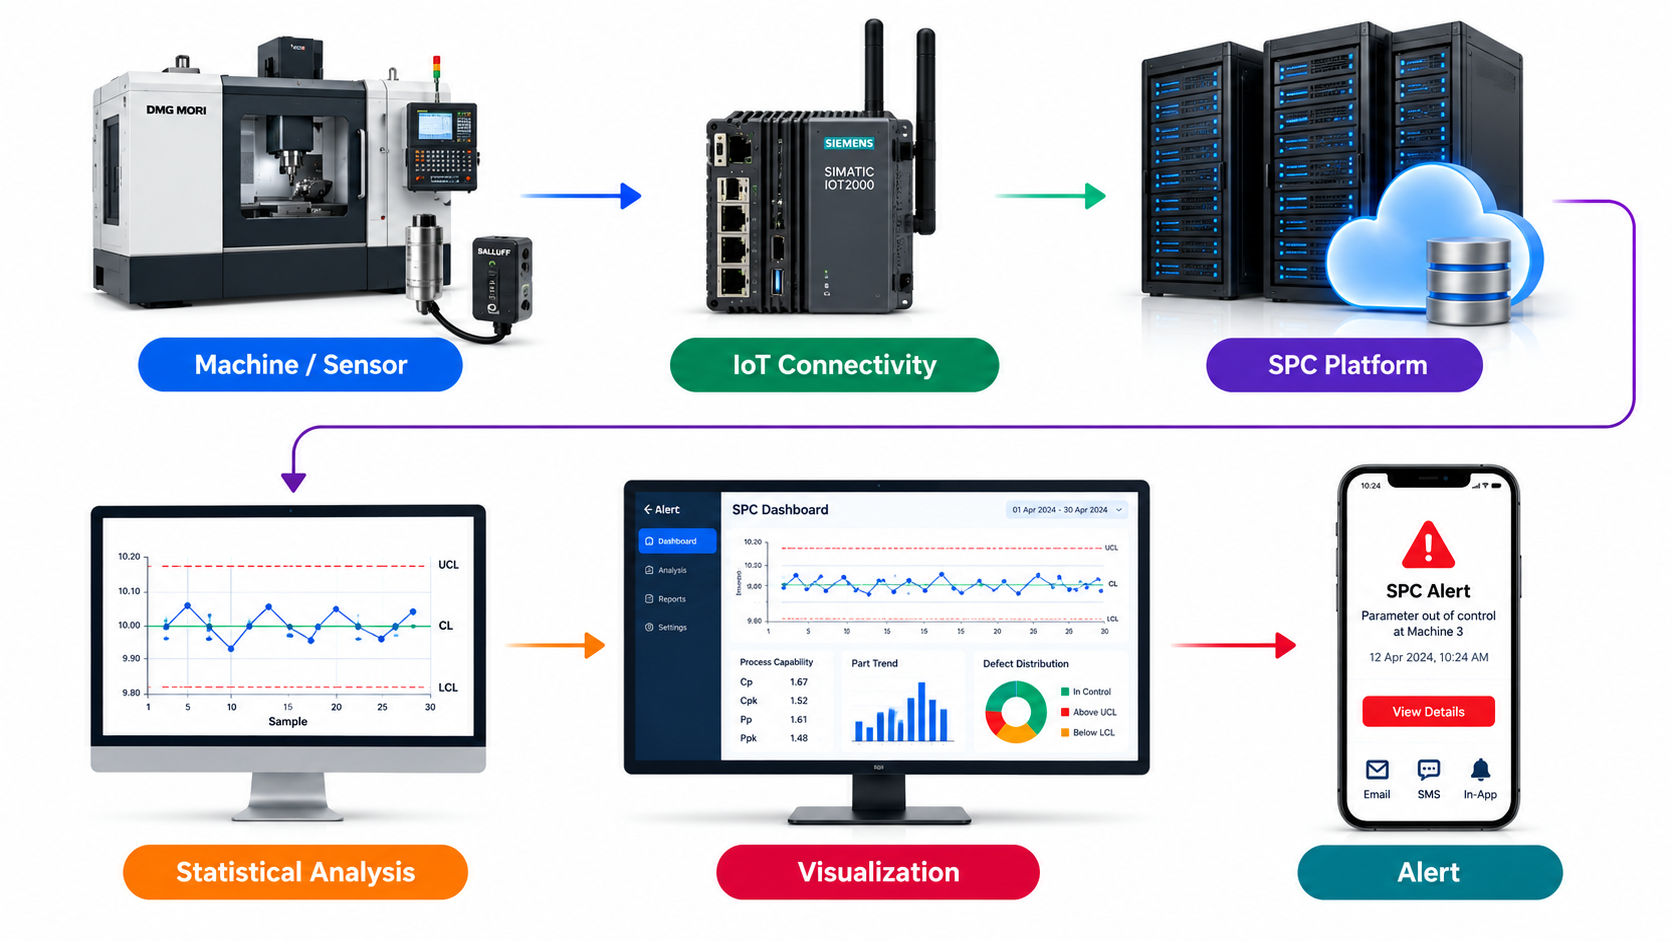
Digital SPC connects production equipment and IoT infrastructure to automatically capture manufacturing measurements from machines, sensors, and connected devices. This reduces manual recording and enables quality information to be analyzed closer to the point of production.
Data Flow
Data Connectivity
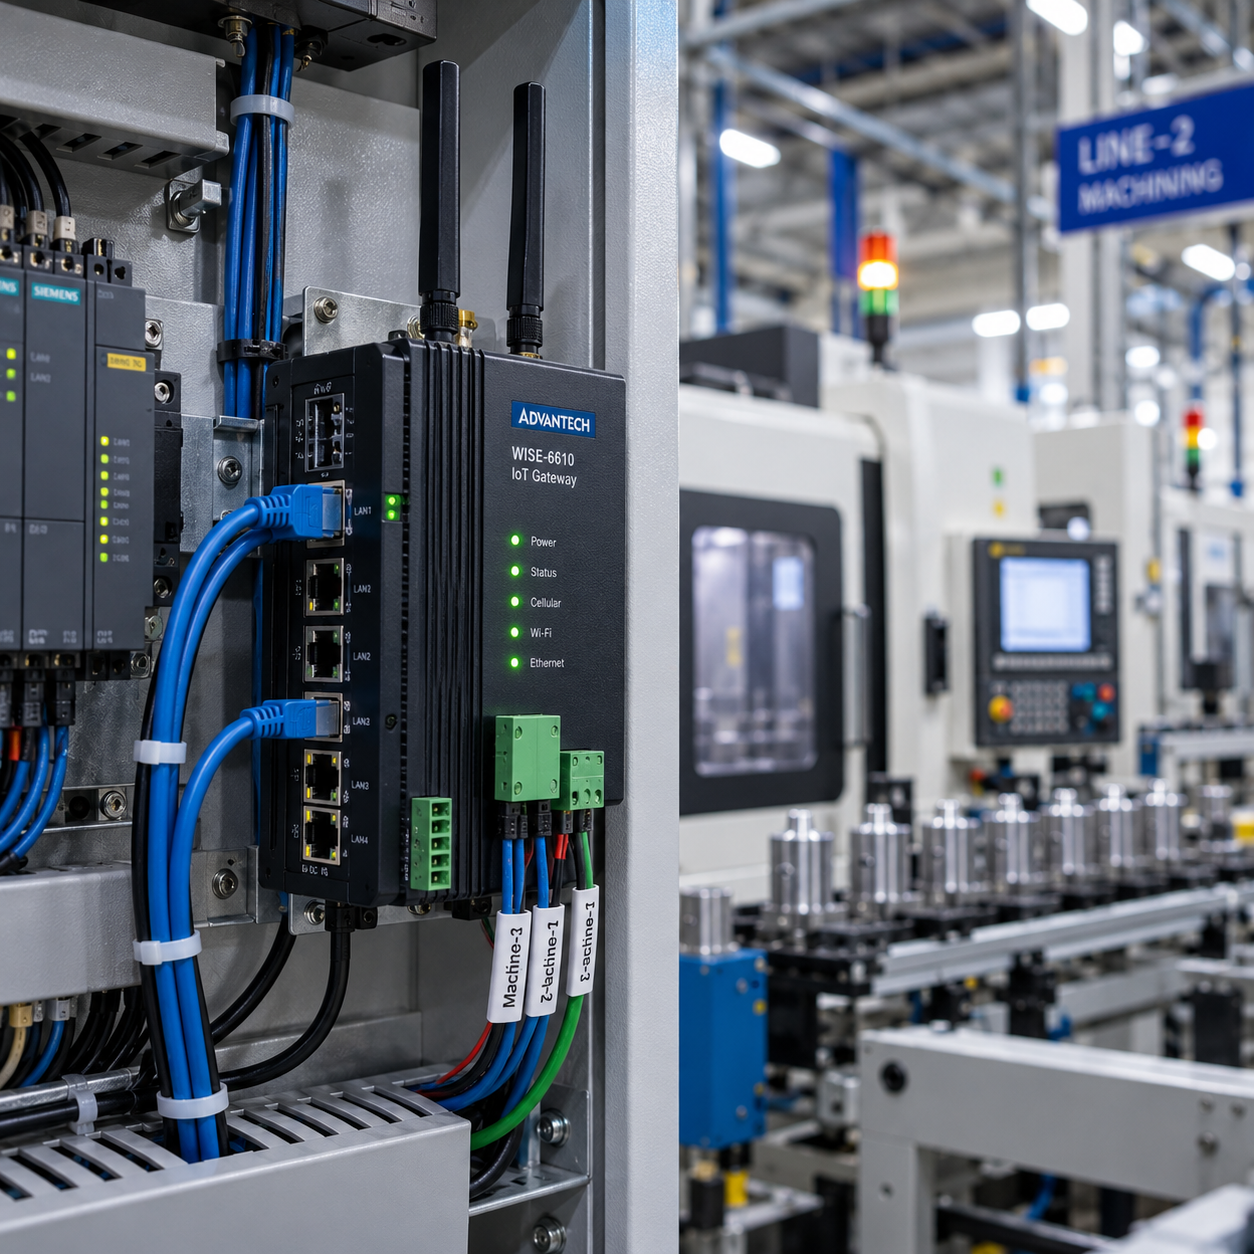
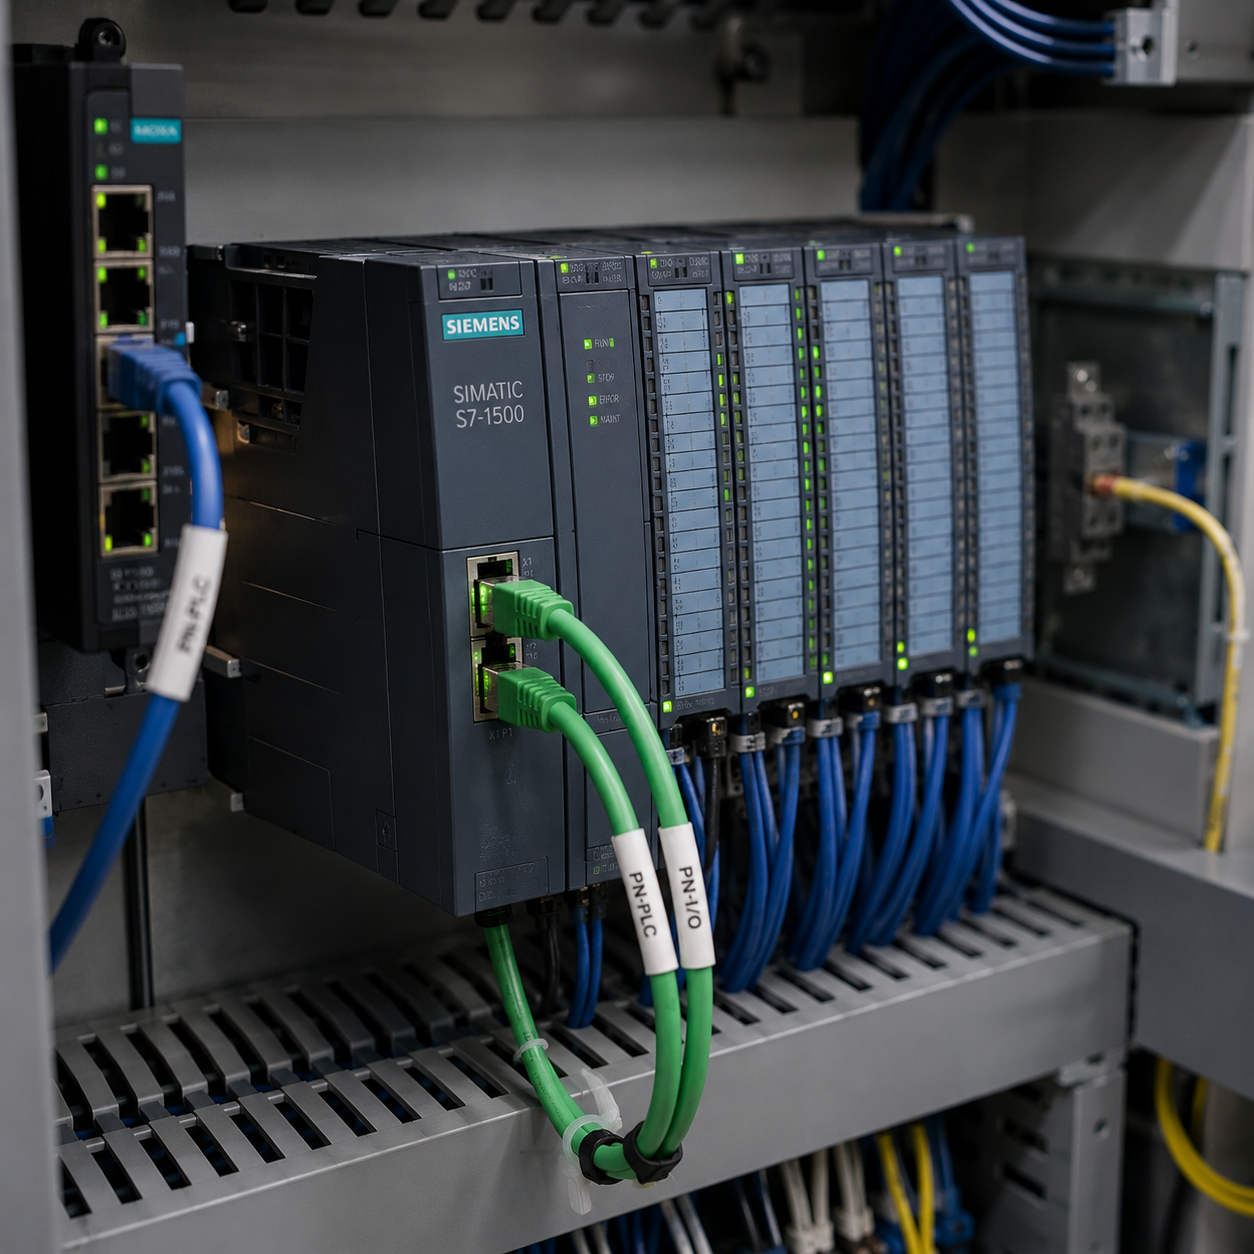
- Connect SPC Software with production equipment and IoT infrastructure to automatically capture manufacturing measurements.
- Collect process data directly from machines, sensors, and connected devices based on the plant architecture.
- Reduce manual recording and analyze quality information closer to the point of production.
- Support both automated machine-based collection and manually entered measurements within a common SPC platform.
Integrating SPC with Manufacturing Systems
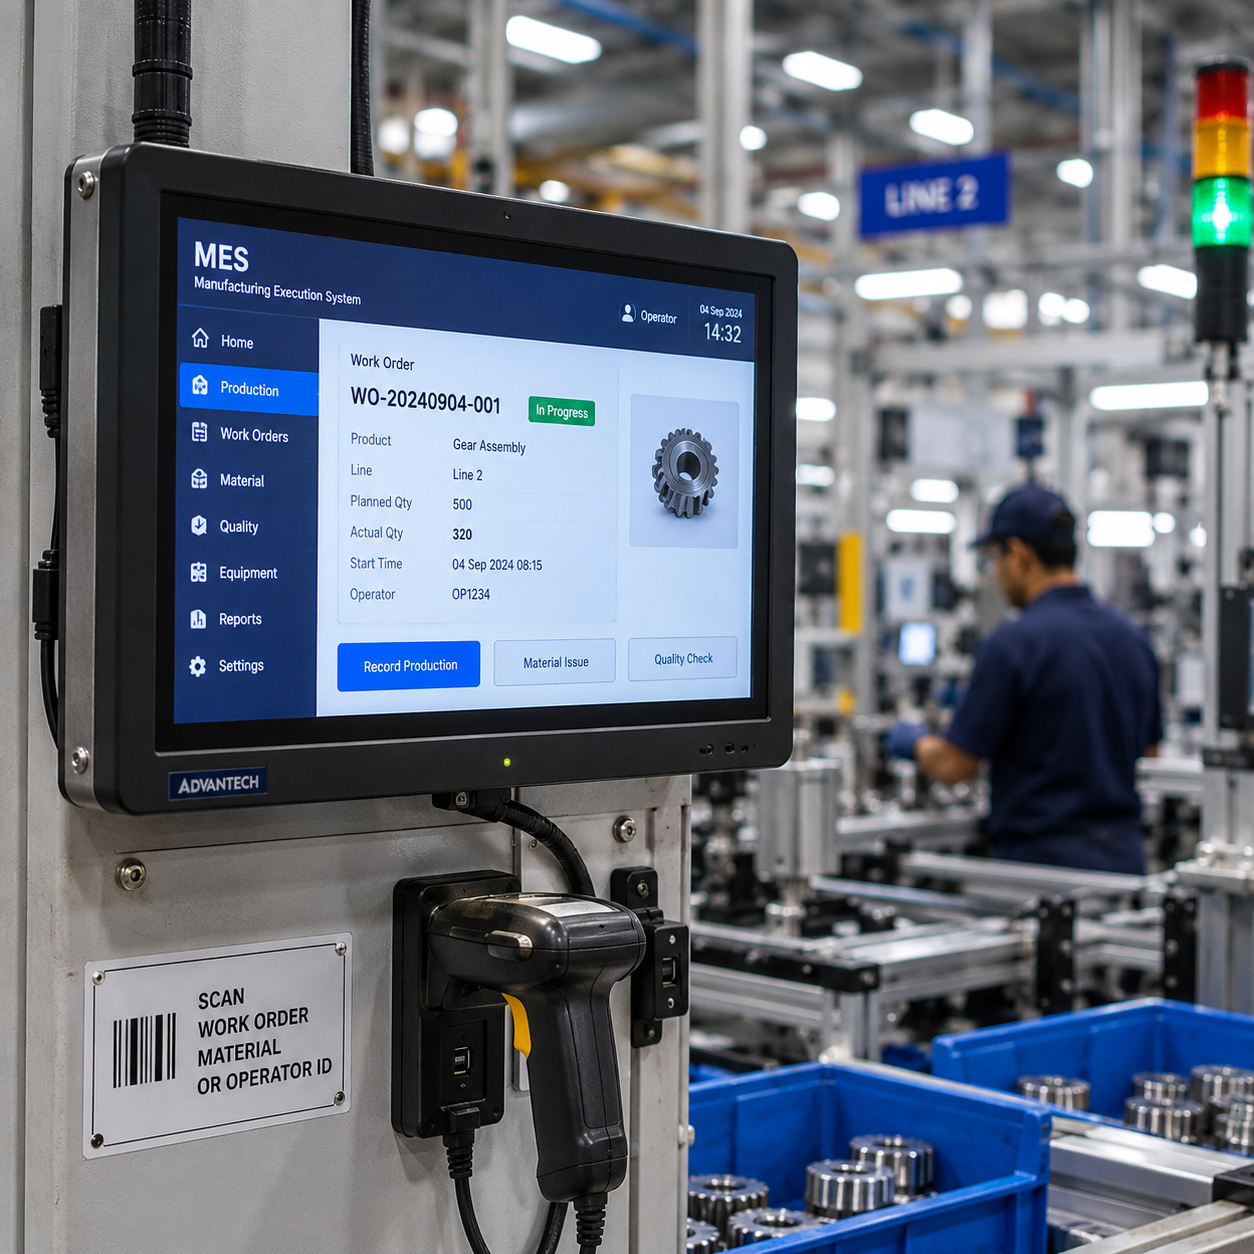
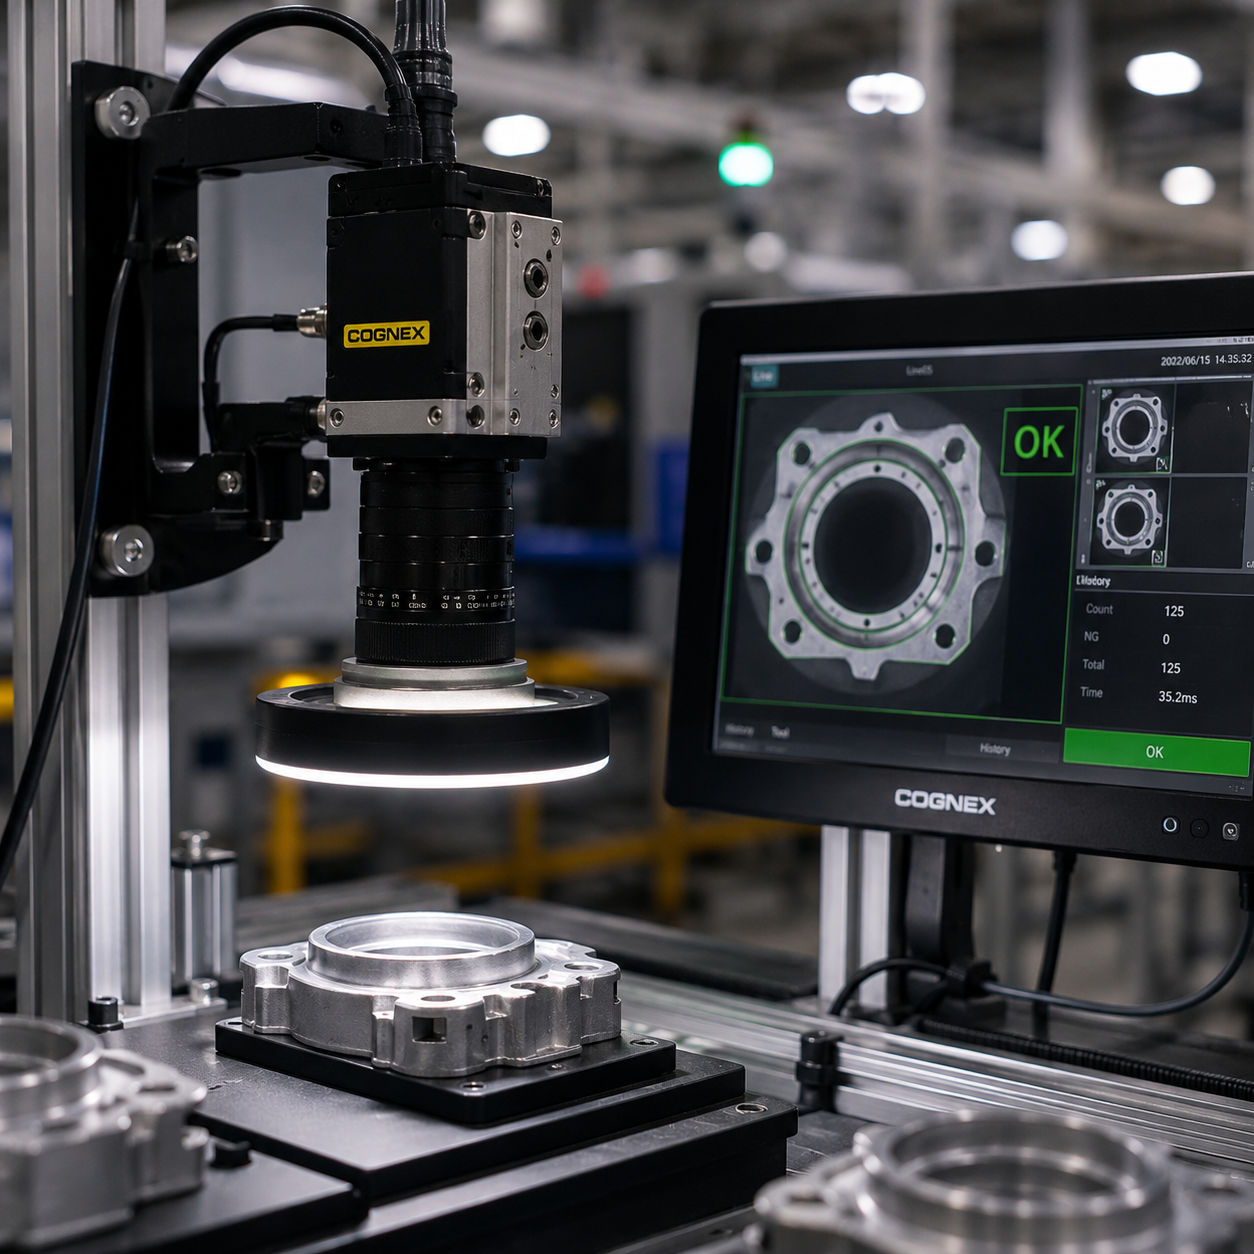
Digital SPC connects production equipment and IoT infrastructure to continuously capture manufacturing measurements and bring process data into a centralized SPC platform. It enables statistical analysis, visualization, and quality alerts while supporting both automated and manual data collection.
IoT Devices
Continuously capture manufacturing measurements.
Machine Connectivity
Connect PLCs and production machines.
MES & ERP
Integrate manufacturing and business data.
Quality Systems
Centralize quality management information.
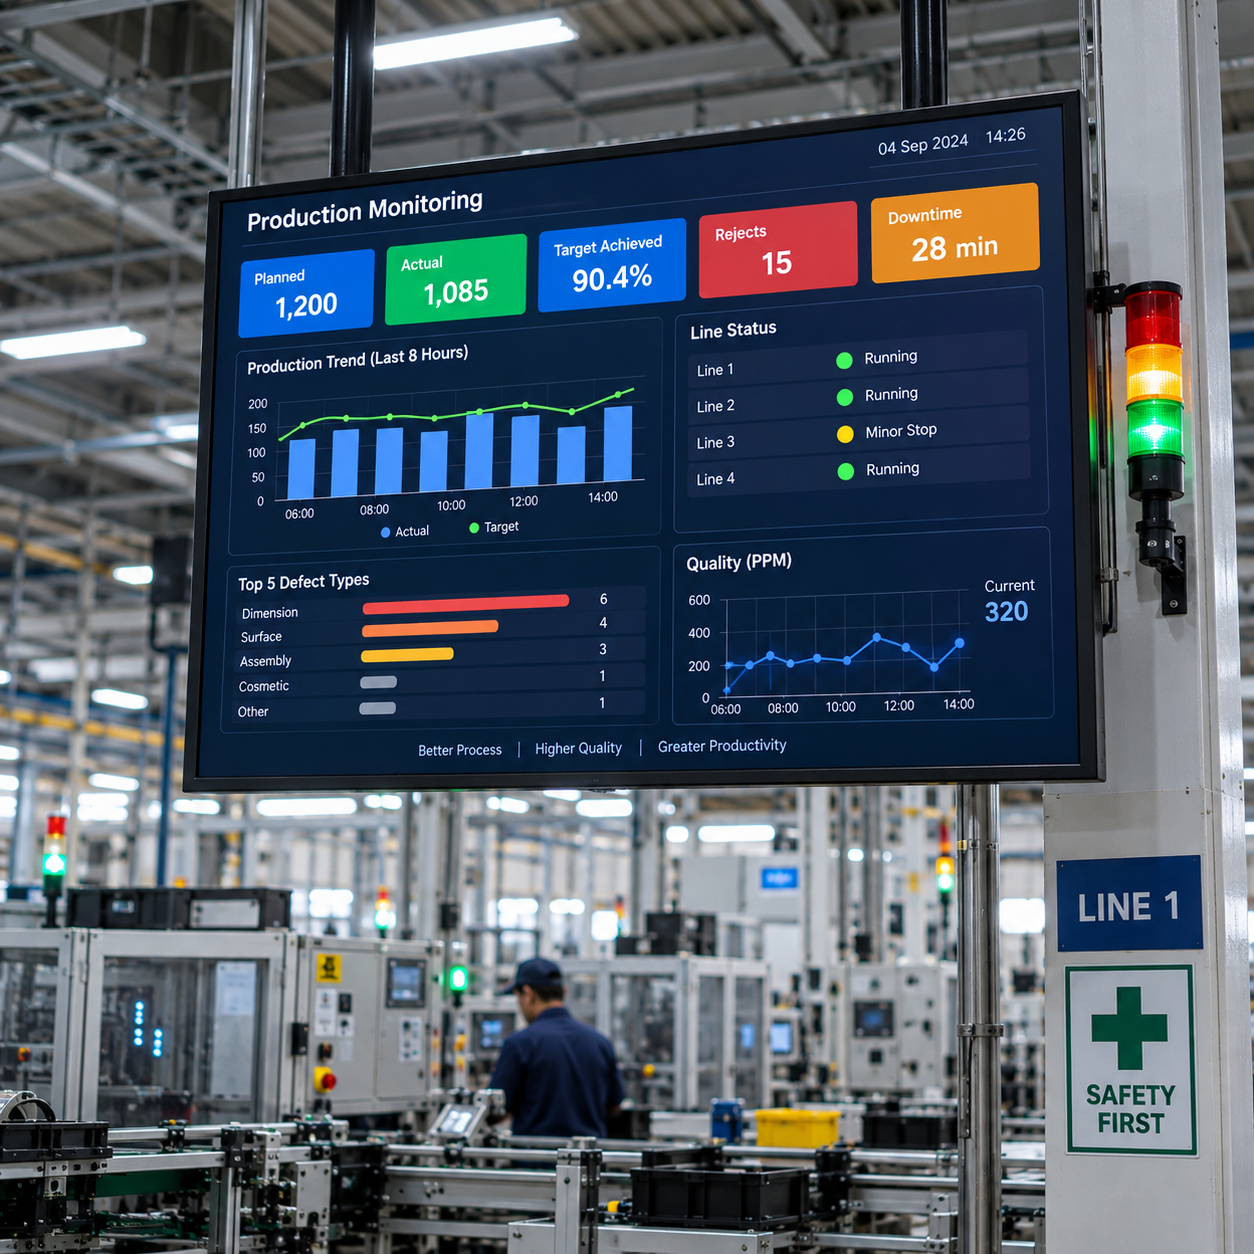
Production Monitoring
Monitor Production manufacturing process performance.
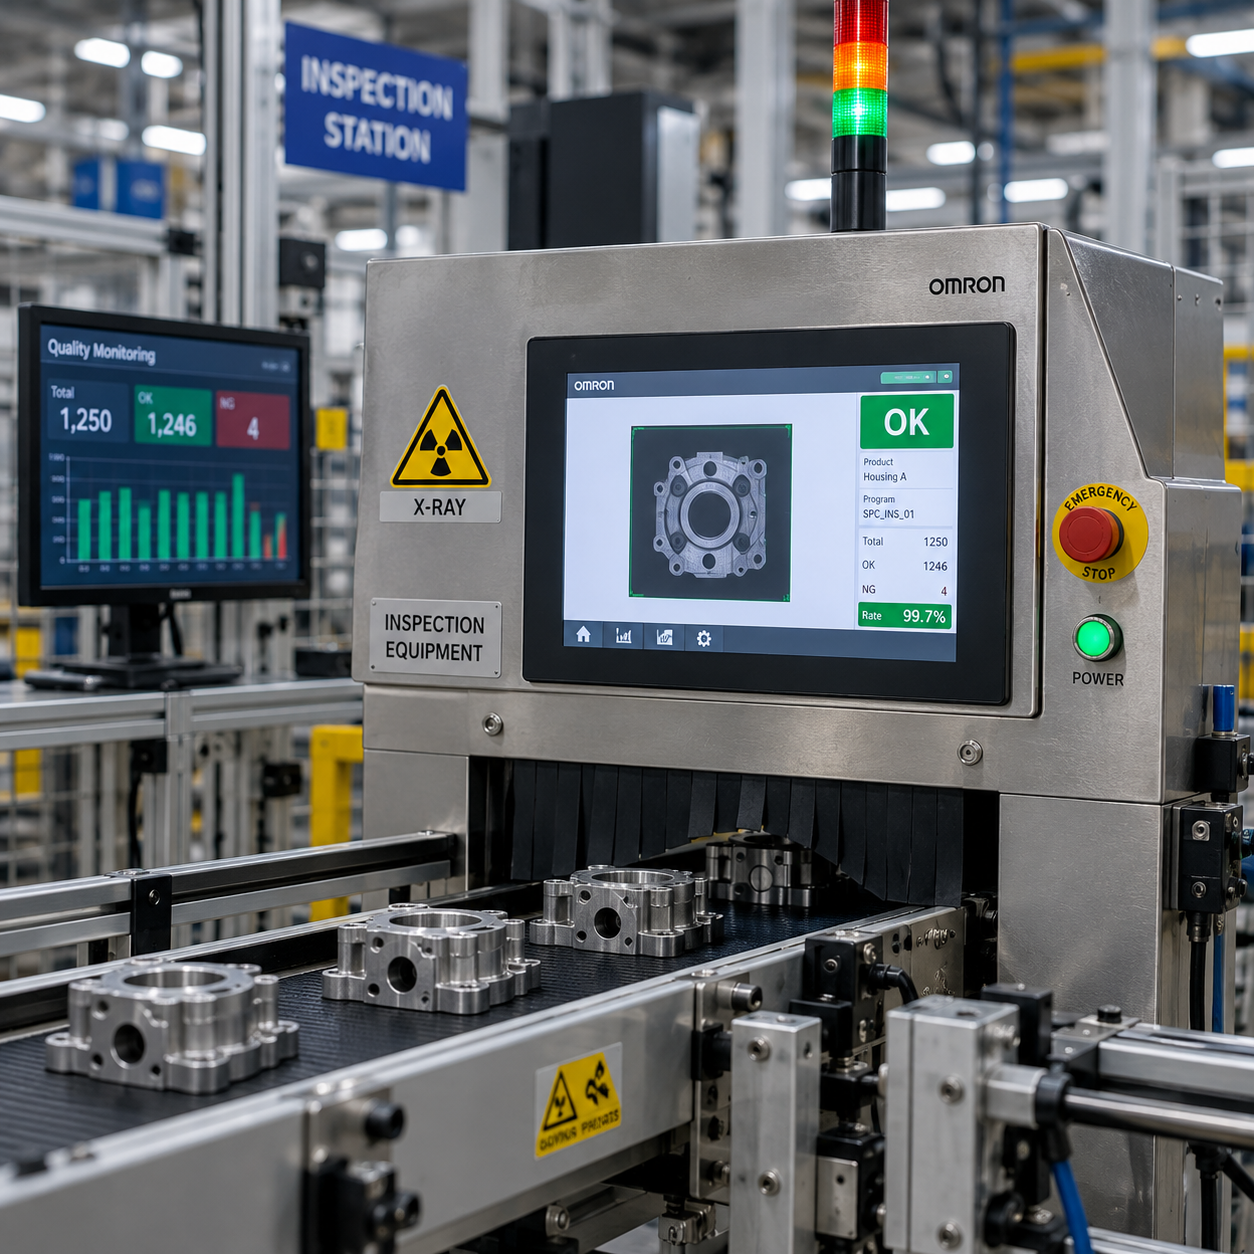
Inspection Equipment
Capture measurements from inspection equipment.
Why Manufacturers Choose Our Digital SPC Software?
Digital SPC helps manufacturers continuously monitor process behavior, identify abnormal variation, and act before process problems become larger quality issues. By bringing measurement data, statistical analysis, machine connectivity, and quality visualization into one platform, it supports proactive quality management and continuous improvement.
Reduce Process Variation
Identify abnormal variation, investigate its causes, and maintain closer control over important manufacturing characteristics.
Detect Quality Problems Earlier
Receive information about abnormal process conditions while production is underway and respond before problems continue.
Improve Product Consistency
Maintain closer control over important manufacturing characteristics to support consistent product quality.
Reduce Manual Work
Automate data collection, statistical calculations, chart generation, and reporting where machine connectivity is available.
Reduce Scrap & Rework
Identify process problems early to help prevent continued production under unfavorable conditions and reduce scrap and rework.
Improve Quality Visibility & Continuous Improvement
Use centralized measurements, statistical information, and historical manufacturing data to identify recurring issues and improvement opportunities.















Our Trusted Clients
We’re proud to collaborate with industry leaders and innovative companies