
Skip to content
Customer Case Study

SPC Software for Aerospace Manufacturing

A digital Statistical Process Control solution designed to support aerospace manufacturing quality through structured process monitoring, statistical analysis, control charts and capability assessment.

Client
Aerospace Manufacturer
Industry
Aerospace Manufacturing
Solution
SPC Software
SPC software for aerospace manufacturing
Aerospace
Manufacturer
Process Monitoring
Structured monitoring of manufacturing process behavior
Statistical Analysis
Production measurements interpreted through SPC methods
Process Capability
Cp and Cpk assessment against defined specifications
Quality Visibility
Statistical insight supporting process review and improvement
Process Variation & SPC

Understanding Process Variation in
Aerospace Manufacturing

In aerospace manufacturing, measured process data can be examined statistically to understand the level and pattern of variation within production. The mean provides a central reference, while standard deviation and sigma help describe the spread of the collected data and support the calculation of control limits.
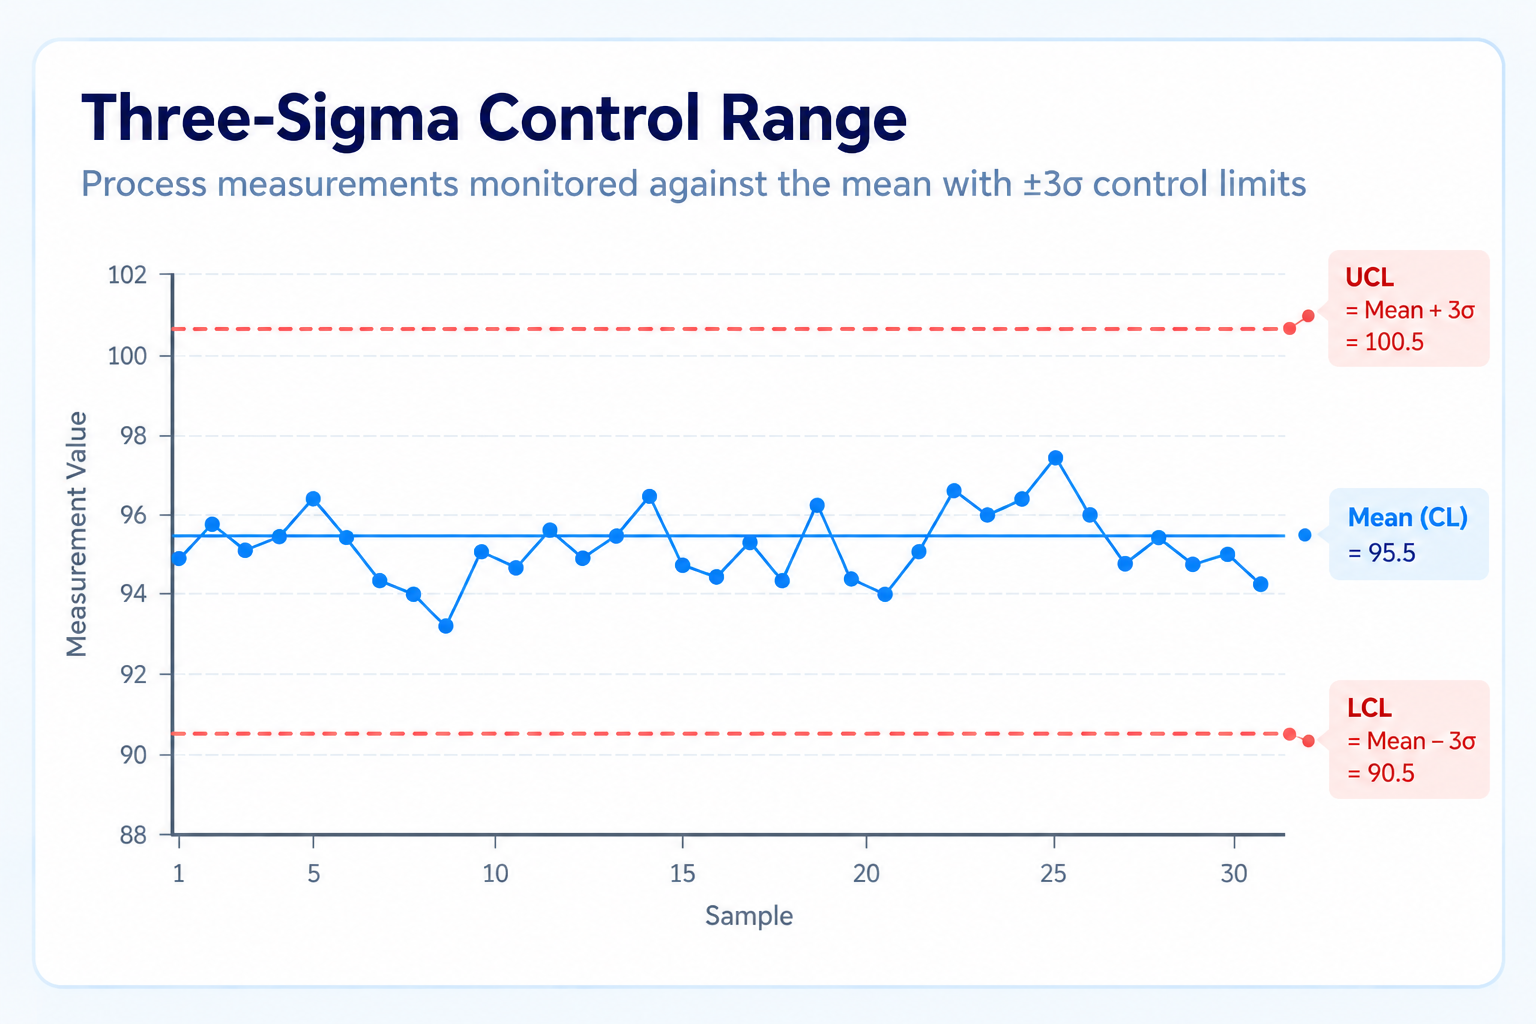
SPC PROCESS ANALYSIS Three-Sigma Statistical Limits
Three-sigma statistical limits for aerospace manufacturing process monitoring
UPPER CONTROL LIMIT UCL = Mean + 3σ
CENTER LINE CL = Mean
LOWER CONTROL LIMIT LCL = Mean − 3σ
01

Mean — Finding the Central Value

The mean is calculated from the measurements collected for the monitored characteristic. It provides a central point that can be used to examine how individual observations move throughout the production sequence.

02

Standard Deviation — Describing Data Spread

Standard deviation (σ) shows the extent of dispersion within the collected measurements. It helps quantify how closely the observations remain grouped around their calculated mean.

03

Sigma — Expressing the Level of Variation

Sigma provides a statistical scale for describing process variation. Selecting a sigma level allows the measurement data to be interpreted against defined statistical boundaries during SPC monitoring.

04

Three Sigma — Setting the Control Range

With a three-sigma approach, control limits are calculated at three standard deviations above and below the process mean. These boundaries provide a statistical reference for examining measurements and identifying values that need further review.

SPC Control Charts

Monitoring Aerospace Manufacturing Processes with Control Charts

Control charts help visualize how a measured characteristic changes across production samples. Within the SPC workflow, chart selection is based on the measurement type, subgroup structure and way the production data is collected.

X̄-R
CONTINUOUS DATA

X̄-R Chart

Suitable for continuous measurements collected in subgroups. It compares the average of each subgroup with its internal range to reveal shifts in the process level and changes in short-term variation.

MONITORS Mean + Range
X̄-S
CONTINUOUS DATA

X̄-S Chart

Designed for continuous subgrouped measurements, this chart evaluates subgroup averages together with standard deviation to identify changes in the process level and the amount of variation.

MONITORS Mean + Standard Deviation
I-MR
CONTINUOUS DATA

Individuals-Moving Range

Intended for continuous measurements where conventional subgroups are not formed. Individual observations are assessed together with moving ranges to follow variation between successive measurements.

MONITORS Individual Values + Moving Range
A
DISCRETE DATA

Attribute Charts

Intended for quality information recorded as counts, such as nonconforming units or defects. The selected chart depends on whether the data represents units, defects or the opportunity for defects.

INCLUDES p, np, c & u Charts
MACHINE DATA & SPC INTEGRATION

Connecting Production Data to SPC Software

The SPC workflow turns production measurements into organized statistical information, creating a clear path from shop-floor data to process monitoring, control limits and quality review.

01

Machine & Production

Manufacturing equipment, inspection activities and production operations generate the measurements and operating information used within the SPC process.

02

Measurement Data

Recorded measurements are associated with the relevant product, characteristic, machine and production context to prepare the data for statistical evaluation.

03

SPC Analysis

The prepared measurements are processed using statistical calculations, variation analysis and the control-chart approach selected for the characteristic.

04

Control Limits

Statistical control boundaries create a reference for assessing incoming measurements and highlighting observations that fall outside the expected process range.

05

Quality Visibility

Quality teams can examine statistical signals, review process conditions and use the available information to guide investigation and improvement activities.

PROCESS CAPABILITY ANALYSIS

Reading Manufacturing Capability from Cp & Cpk

After SPC monitoring establishes the amount of variation present in production measurements, capability analysis provides a comparison between that measured behavior and the permitted specification range. Cp and Cpk offer two different perspectives when reviewing a continuous characteristic.

Cp
PROCESS SPREAD

Specification-to-Variation Relationship

Cp = (USL − LSL) / 6σ

Cp relates the total specification width to the statistical spread represented by six standard deviations. The index focuses on the amount of variation rather than the position of the process mean.

VIEW Process Variation
SPECIFICATION USL & LSL
Cpk
PROCESS POSITION

Specification Alignment

Cpk = min[(USL − μ) / 3σ, (μ − LSL) / 3σ]

Cpk combines the calculated mean with the observed data spread and evaluates the process against both specification sides. The resulting index reflects how variation and process positioning relate to the defined tolerance range.

VIEW Variation + Mean Location
SPECIFICATION USL, LSL & Mean
CAPABILITY INPUTS

Values Used to Calculate Cp & Cpk

USL

Upper Specification Limit

Defines the maximum target boundary established for the selected quality characteristic.

LSL

Lower Specification Limit

Defines the minimum target boundary established for the selected quality characteristic.

μ

Process Mean

Shows the average level calculated from the measurements collected for the selected characteristic.

σ

Standard Deviation

Shows how widely the collected measurements are distributed around their calculated average.

CHALLENGES & RESULTS

Supporting Aerospace Quality Through Structured SPC Monitoring

The SPC solution provided a structured approach for working with production measurements, statistical analysis and process-monitoring information, helping quality teams review variation and process conditions more effectively.

Challenges

Process Visibility

Production data needed to be easier to examine so quality teams could understand measurement patterns across monitored manufacturing activities.

Statistical Monitoring

Measurement data required a consistent statistical approach for reviewing process behavior and identifying meaningful changes.

Variation Detection

Changes in process behavior needed to be recognized through statistical signals for further quality investigation.

Control Chart Selection

Different process characteristics required suitable control chart methods based on the type and structure of the data.

Capability Assessment

Process variation also needed to be evaluated against defined specification limits using capability measures such as Cp and Cpk.

Results

Structured SPC Monitoring

Production measurements can be reviewed within a structured SPC workflow covering statistical analysis and process monitoring.

3-Sigma Monitoring

Statistical control limits provide a reference for identifying observations that may indicate unusual changes in process behavior.

Control Chart Monitoring

Appropriate control chart methods support monitoring of continuous and attribute-based process characteristics.

Cp & Cpk Analysis

Capability measures provide additional insight into process spread and centering in relation to specification limits.

Quality Visibility

Statistical information gives quality teams a clearer basis for reviewing process signals and supporting improvement activities.

DISCUSS YOUR SPC REQUIREMENT

Bring Production Data, SPC & Quality Together

Explore how structured statistical process control can connect production measurements, process analysis and quality monitoring within your manufacturing environment.

Contact Us
CUSTOMER CASE STUDY
Aerospace Manufacturer
Supporting aerospace manufacturing quality through structured statistical process control and process monitoring.
SPC Software Aerospace Manufacturing