
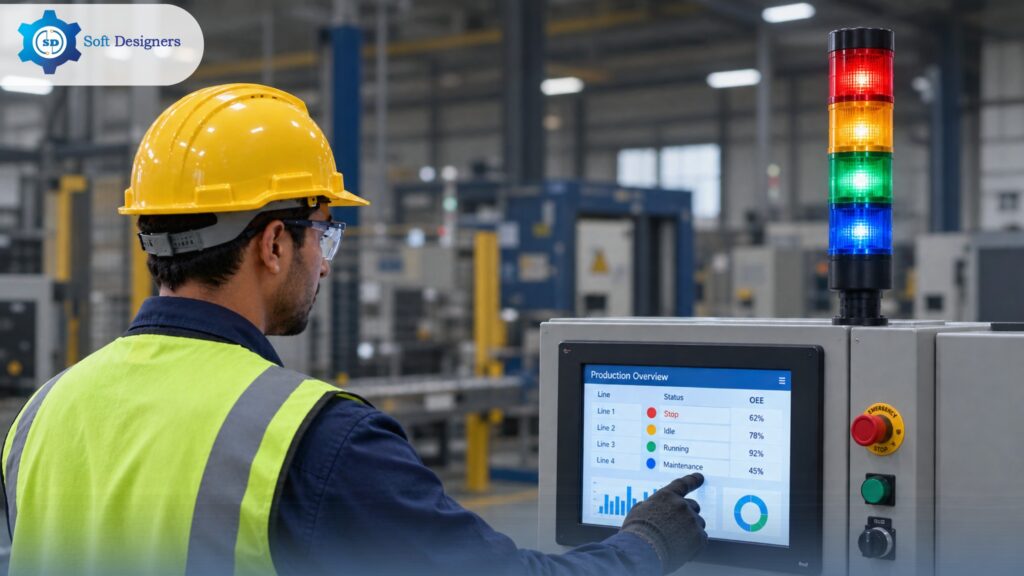
Andon lights are visual signalling devices that communicate machine status, production interruptions, quality concerns, and requests for assistance on a manufacturing floor. A clear signal allows operators, supervisors, and maintenance teams to recognise a problem quickly and decide who should respond.
Several types of Andon lights are in use, and they differ in how they illuminate, sound, mount, and connect. Physical signals alone, however, have limits in a large facility. A light is visible only to those who can see it, and it records nothing about how long a problem lasted or who responded.
Andon software addresses these limits. It extends physical signalling through a central dashboard, digital notifications, configurable workflows, historical records, and reporting. This article explains the main types of Andon lights and shows how compatible software helps plant and operations leaders turn isolated signals into a structured response and improvement process. For manufacturing decision-makers, the combination of hardware and software determines how quickly a problem is noticed, who responds, and what the plant learns afterwards.
What Are Andon Lights and How Do They Work?
Andon lights are industrial signal devices that indicate the operating status of a machine, workstation, or production line. They alert operators, maintenance teams, and supervisors when a machine fault, material shortage, or other production issue requires attention.
An Andon system typically includes a signal tower, a control mechanism, and an activation method. Operators can trigger alerts using push buttons or pull cords, while machine faults can activate signals automatically through a PLC. Depending on the setup, an audible alarm may also accompany the visual signal.
For example, when an assembly operator runs out of components, activating the material-request signal alerts the material-handling team. Similarly, a machine fault can trigger a signal that calls for maintenance support. The light remains active until the issue is addressed and the system is reset according to the plant’s procedure.
When connected to Andon software, these signals can also appear on a central dashboard, where teams can track alerts, record downtime, monitor response times, and identify recurring production issues.
Different Types of Andon Lights Based on Colour
Colour conventions help personnel interpret signals at a glance. Green commonly indicates normal operation, yellow signals a warning or a need for assistance, red marks a critical issue, machine fault, or production stoppage, and blue is often reserved for a specialised request defined by the facility.
Meanings vary between facilities. A widely used industrial convention treats red as a raised issue, yellow as an issue under action, and green as a resolved issue. Standardised colour coding, documented and followed consistently, matters more than any particular scheme. Operators and maintenance staff should be trained on the adopted scheme during induction.
Different Types of Andon Lights Based on Design and Operation
The following configurations describe how Andon lights illuminate, sound, mount, and communicate.
Steady Andon Lights
A continuously lit signal shows an active or ongoing condition, such as normal running or a fault that remains unresolved. Persistent illumination suits workstations where the status must stay visible until someone deliberately changes it. A press line with a long cycle is a typical example.
Flashing Andon Lights
Intermittent illumination draws attention faster than a constant glow. Flashing separates urgent or newly raised alerts from ordinary status indications, which helps when several lights are visible from the same position. Selected faults can flash while routine states remain steady.
Andon Lights with Buzzers
An audible alarm supplements the visual signal when personnel may not be looking at the tower. Buzzers suit large bays or workstations where attention is directed elsewhere, although the tone must remain distinguishable from background machinery noise. Heavy fabrication shops often depend on this configuration.
Andon Lights Without Buzzers
Visual-only units communicate status without adding noise, which suits quiet assembly areas and laboratories. The effectiveness of an Andon light depends on its location, as equipment or poor visibility can prevent workers from noticing the signal promptly. Careful positioning at eye level near the operator improves reliability.
Beacon or Rotating Andon Lights
A beacon produces a prominent, often rotating, light pattern that reaches across a designated area. Unlike a conventional signal tower, which shows several states in stacked segments, a beacon usually conveys a single alert and suits large halls where distance matters. Warehouses and large assembly halls commonly use them.
Wall-Mounted Andon Lights
Fixed wall units communicate status at designated workstations or production areas. They suit lines where floor space is limited or where a tower would obstruct movement, and they give nearby personnel a consistent viewing position. Electronics assembly benches and compact production cells often use this arrangement.
Wireless Andon Lights
Wireless communication offers installation flexibility, since lights can be positioned without running signal cables to every point. Reliable connectivity, a suitable power supply, and compatibility with the controller or software must still be confirmed, particularly where signal interference is likely. Temporary lines and relocated workstations benefit most from this flexibility.
Ethernet-Connected Andon Lights
These categories overlap, so a wireless light may also flash or include a buzzer. Hardware characteristics differ between products, and not every configuration automatically supports software integration.
How Andon Software Enhances the Functionality of Andon Lights
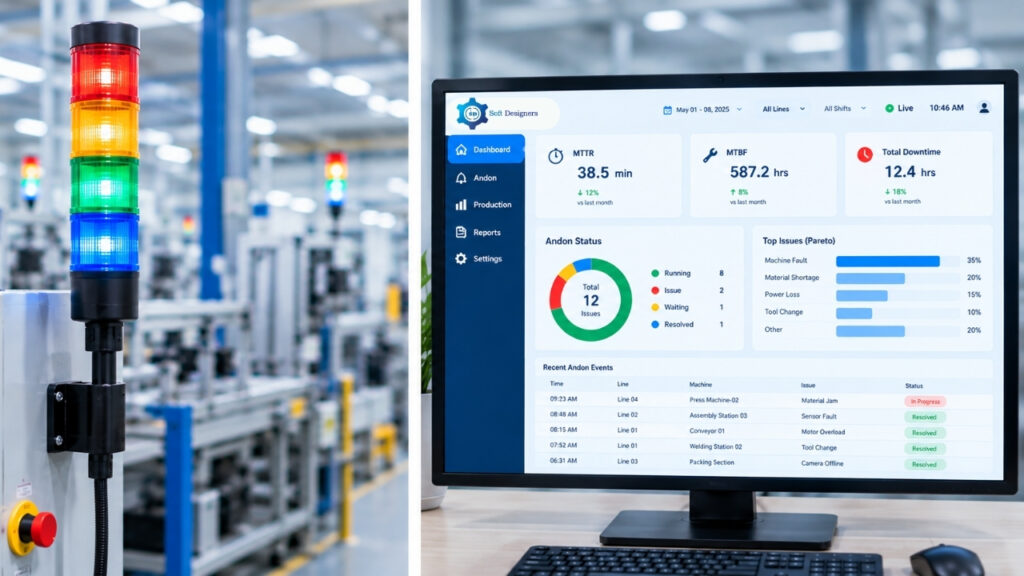
Compatible Andon software turns a physical signal into a managed process for monitoring, communicating, resolving, and analysing manufacturing issues. The capabilities below follow the Soft Designers Andon software unless stated otherwise, while analytical methods apply to suitable recorded data. Each capability is described below in terms of what it does and why it matters on the shop floor.
Central Dashboard and Real-Time Visibility
A central dashboard consolidates connected machines, workstations, active alerts, and unresolved issues into one view. Supervisors and production managers can review status without depending on line of sight to individual lights, which matters when lines are spread across bays, floors, or buildings.
The dashboard shows where an issue is located, its current state, and where attention is needed. A plant manager can therefore see at a glance which line is stopped, how long the stoppage has lasted, and whether anyone has responded, without leaving the office. This visibility extends across configured plants, production lines, stations, and machines, and across several plants through a cloud-based setup with web and mobile access.
Andon System Configuration
Configuration aligns the system with how a plant actually operates. The reference software allows plants, lines, workstations, and machines to be configured to match the manufacturing hierarchy, lets operators raise issues from tablets, smart workstations, or connected equipment, and applies escalation according to configured response thresholds. Machine-triggered alerts are also described through PLC and sensor connectivity.
Related settings in compatible systems typically include issue categories, assigned teams, notification recipients, and dashboard views. Consistent configuration supports standardised reporting, clearer ownership, and more dependable issue handling, because the same event is always classified and routed in the same way. Without agreed settings, two shifts may describe one fault differently, and the resulting reports cannot be compared reliably.
Reports and Trends
Suitable Andon software records events, timestamps, issue categories, acknowledgement, response, and resolution details. Its reports cover issue management, downtime tracking, maintenance response, performance analysis, and historical insights, alongside MTTR and MTBF indicators. Managers can use such records to examine fault frequency, production interruptions, downtime patterns, and response and resolution times, and, where the data exists, to compare recurring problems by machine, workstation, or shift.
A light shows only the present condition. History reveals patterns, such as one station stopping repeatedly during the same shift, and those patterns inform maintenance planning, operational reviews, and corrective action. Downtime reporting of this kind also gives maintenance managers evidence for scheduling inspections and planning spare parts. Reviewing records weekly further shows whether earlier fixes reduced repeat events or merely moved the problem elsewhere.
Pareto Analysis and Issue Prioritisation
Pareto analysis ranks problems by contribution so that effort goes where recorded losses are greatest. The reference software lists Pareto analysis among its Andon analytics. Recorded data can be grouped by machine, fault category, workstation, frequency, or downtime contribution and ranked by the chosen metric.
Consider a production plant where machines repeatedly stop because of feeder jams and sensor faults. After reviewing the Andon software dashboard at the end of the month, the maintenance team discovers that these two issues account for a large share of total downtime. Instead of addressing every fault equally, the team prioritises these recurring problems, investigates their root causes, and implements corrective actions. In the following month, the team reviews the Pareto report to determine whether the changes have reduced downtime. This helps the plant focus maintenance efforts on the issues with the greatest operational impact.
Digital Notifications, Acknowledgement, and Escalation
Digital notifications carry the alert beyond the people standing near the light. Mobile app, SMS, and WhatsApp channels are supported for configured alerts. Acknowledgement and resolution tracking establish whether an issue has received attention: the responsible person acknowledges the alert, the status changes, and closure is recorded once corrective action ends.
When an alert stays unacknowledged or unresolved beyond the configured threshold, escalation notifies the next level of management. Escalation levels and timings are configured by the plant, so thresholds should reflect realistic repair durations. These timestamps feed the dashboard and reports, so response performance becomes measurable rather than assumed. A supervisor can then distinguish a slow response from a slow repair, which calls for different corrective actions, and can review escalation events during shift handovers.
Traditional Andon Lights vs Software-Connected Andon Lights
Both approaches have a place in manufacturing, and the practical differences are summarised below. Traditional Andon lights signal issues at the workstation, while software-connected systems extend monitoring through a central dashboard, instant notifications, event tracking, and detailed reports.
| Dimension | Traditional Andon Lights | Software-Connected Andon Lights |
|---|---|---|
| Signal visibility | Local visual and audible signals seen near the station | Local signals plus status on connected screens and mobile devices |
| Central dashboard | Usually none, so status is read at each light | Consolidated view of machines, stations, and active issues |
| Alert communication | Depends on personnel noticing the light or buzzer | Configured digital notifications to responsible personnel |
| Configuration and escalation | Fixed wiring or controller logic, with manual follow-up | Configurable categories, assignments, and rule-based escalation |
| Historical records and reports | Limited unless events are logged separately | Recorded events supporting downtime and response reports |
| Pareto analysis and issue prioritisation | Possible only when data is compiled in a separate tool | Possible on recorded data, while a built-in chart depends on the product |
| Acknowledgement and follow-up | Typically verbal or paper-based | Tracked acknowledgement, resolution, and closure |
Not every traditional installation lacks reporting, and not every software-connected system delivers advanced analytics automatically. Analysing recorded data in a separate tool differs from using a built-in Pareto report, so capabilities should be confirmed before purchase. Either way, software extends the functionality of physical lights rather than making them unnecessary.
Conclusion
Choosing suitable Andon lights depends on visibility requirements, signalling methods, installation conditions, and connectivity. Physical signals remain the first line of communication on the floor, and their placement and type should match how personnel actually work. Compatible Andon software then extends them through a central dashboard, configured workflows, notifications, historical reports, and analysis of recurring production problems, including Pareto analysis applied to recorded issue data.
An Andon system is a basic building block of a smart factory, providing real-time visibility into machine faults, production stoppages, and material shortages. When connected to Andon software, it enables faster responses, downtime analysis, and data-driven improvements.
Manufacturers can explore the Soft Designers Andon system and request a demo to evaluate its suitability for their machines, workstations, and reporting requirements.