
An EHS team can hit its target injury rate for an entire year and still be one bad shift away from a serious incident. That gap between what the numbers show and what is actually happening on the ground is the reason leading and lagging indicators in EHS performance need to be read together, not separately. Injury counts, spill reports, near miss tallies, and audit findings tell you what already happened. Inspection rates, training records, and toolbox talk attendance tell you what is likely to happen next. This is, at its core, the difference between a reactive safety program and a proactive one: reactive means responding to problems only after they surface as an incident, while proactive means acting on early warning signs to keep that incident from happening in the first place. Read on to see how each type of indicator works, where organizations most often go wrong, and how to bring the two together into one balanced view of safety performance.
What Are Lagging Indicators in EHS Performance?
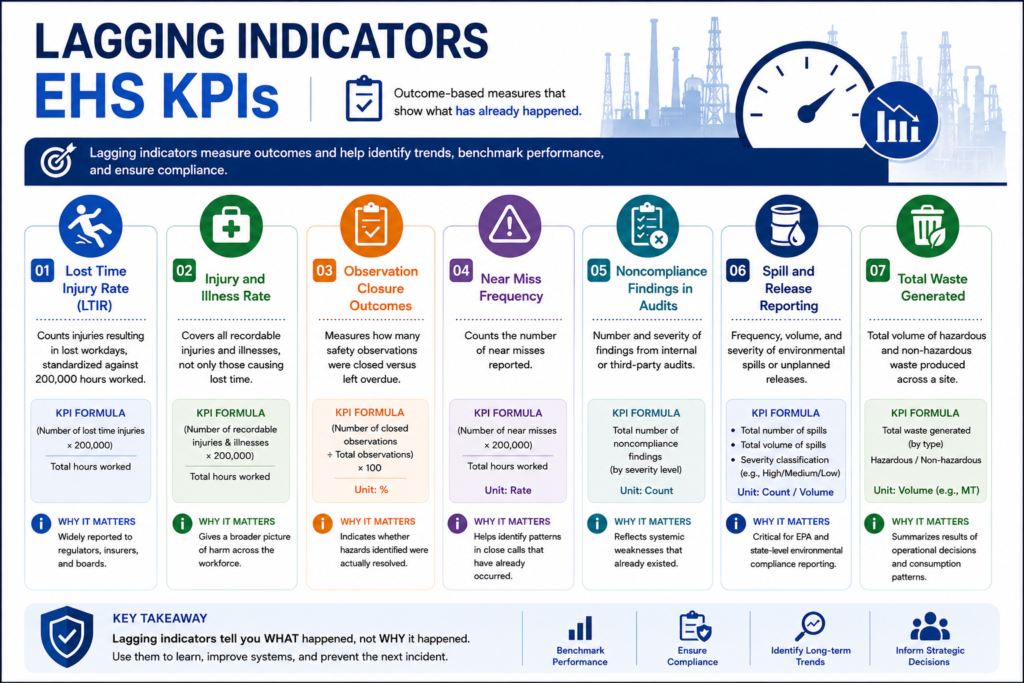
Lagging indicators in EHS are outcome measures. They tell you what has already happened, after the fact, and there is no way to use them to stop an incident that has already occurred. They still matter for benchmarking against industry peers, satisfying regulatory reporting requirements, and spotting long-term trends, but a low number on any of them is not proof that the workplace is safe. It may only mean nothing has gone wrong yet.
- Lost Time Injury Rate (LTIR): counts injuries resulting in lost workdays, standardized against 200,000 hours worked. It is one of the most commonly reported figures to regulators, insurers, and boards, but a low LTIR can just as easily mean an organization has been lucky as it can mean the workplace is genuinely well controlled.
- Injury and illness rate: covers all recordable injuries and illnesses, not only the ones that cause lost time. This gives a wider picture of harm across the workforce, though it is still a count of things that already went wrong.
- Observation closure outcomes: the act of submitting a safety observation is proactive, but the data on how many observations were actually closed versus left overdue is a lagging measure of whether hazards spotted in the field were ever fixed.
- Near miss frequency: reporting a near miss is a proactive behavior, but the resulting count is a backward-looking tally used to spot patterns in close calls that have already occurred.
- Noncompliance findings in audits: the number and severity of findings from internal or third-party audits describe conditions that existed at the time of the audit. They point to systemic weaknesses, but those weaknesses were already present before anyone found them.
- Spill and release reporting: the frequency, volume, and severity of environmental spills or unplanned releases sit firmly in the lagging category, and they carry significant weight in EPA and state-level environmental compliance reporting.
- Total waste generated: the total volume of hazardous and non-hazardous waste produced across a site is a lagging figure. It sums up the result of consumption patterns and operational decisions after the fact, rather than acting as a control that keeps waste volumes down in the first place.
What Are Leading Indicators in EHS Performance?
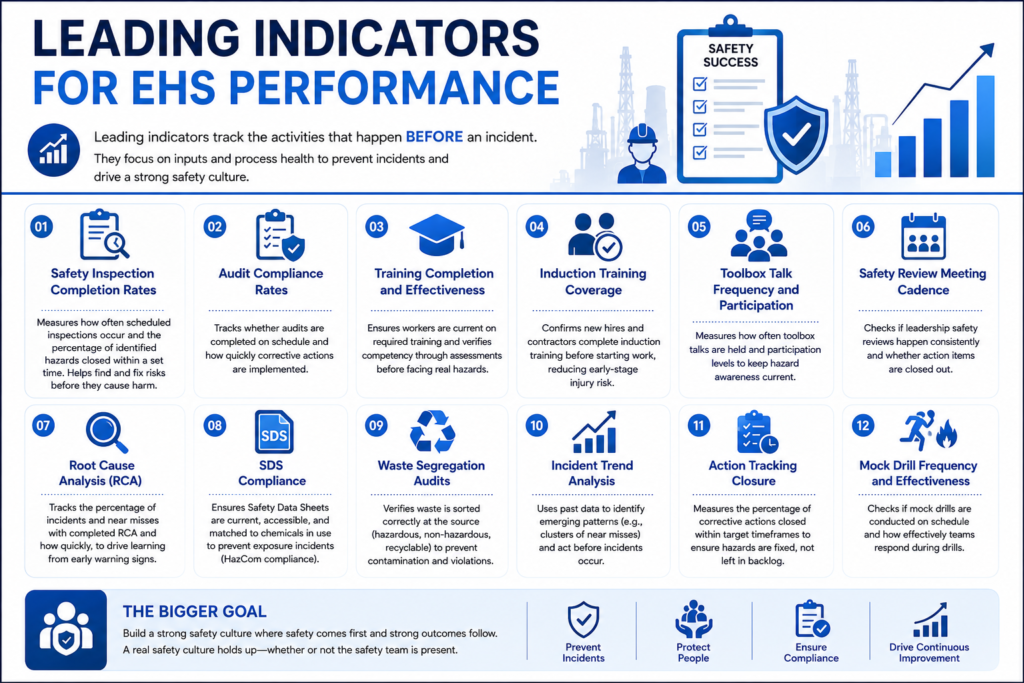
Leading indicators in EHS track the activities that happen before an incident, not after one. They look at inputs and process health rather than results, which is what makes them useful for catching a weak spot in the safety management system while it is still just a weak spot, before it becomes an injury, a release, or a citation.
- Safety inspection completion rates: how often scheduled inspections actually happen and what share of the hazards they turn up get closed within a set timeframe says a lot about whether an organization is finding risk before it turns into harm.
- Audit compliance rates: this is not about what the audits find, but whether they happen on schedule in the first place and how fast the resulting corrective actions get implemented.
- Training completion and effectiveness: the share of workers current on required training, paired with how they actually score on competency checks, shows whether the workforce has the knowledge it needs before that knowledge gets tested by a real hazard.
- Induction training coverage: new hires and contractors get hurt at higher rates in their first weeks on a job. Making sure induction training is complete before anyone starts work is one of the more direct ways to head off that risk.
- Toolbox talk frequency and participation: toolbox talks keep hazard awareness current for the tasks a crew is actually doing that day.
- Safety review meeting cadence: whether leadership safety reviews happen consistently, and whether action items from those meetings actually get closed out, shows whether safety is a real priority or just an item on the agenda.
- Root cause analysis (RCA): what share of incidents and near misses get a completed root cause analysis, and how quickly, shows whether an organization is learning from early warning signs or just logging them and moving on.
- SDS compliance: keeping Safety Data Sheets current, accessible, and correctly matched to the chemicals actually in use on-site heads off exposure incidents before they happen, which is exactly what OSHA’s Hazard Communication Standard is built around.
- Waste segregation audits: scheduled checks that waste is being sorted correctly at the source, hazardous from non-hazardous, recyclable from general waste, catch segregation errors before they turn into contamination or a disposal violation.
- Incident trend analysis: it draws on past data, but using it to spot an emerging pattern, say, a cluster of near misses building up in one process area, lets a team step in before a lagging metric confirms there was ever a problem.
- Action tracking closure: the percentage of corrective actions, whether from an inspection, an audit, or an observation, that get closed within their target timeframe shows whether identified hazards are actually being fixed or just accumulating in a backlog nobody is clearing.
- Mock drill frequency and effectiveness: fire and emergency mock drills conducted on schedule, along with how quickly a site actually evacuates or responds during the drill, show whether emergency preparedness works in practice rather than just existing on paper.
Beyond any single metric, the goal is to make safety a genuine culture rather than a checklist, one where safety comes first and strong outcomes follow as a result, not the other way around. A real safety culture holds up regardless of whether the safety team happens to be present or watching a given task at a given moment.
Leading vs. Lagging Indicators in EHS Performance: Key Differences
The table below summarizes how leading and lagging indicators in EHS performance differ across the dimensions that matter most for program design.
Dimension | Leading Indicators | Lagging Indicators |
Timing | Measured before an incident occurs | Measured after an incident occurs |
Focus | Process performance and proactive safety activities | Incident outcomes and safety performance results |
Purpose | Prevent future incidents and reduce risk | Measure past performance and confirm safety outcomes |
Data Source | Inspections, training records, toolbox talks, audit schedules, safety observations | Incident reports, injury logs, spill records, workers’ compensation claims, regulatory citations |
Examples | Safety inspections, training completion, toolbox talks, root cause analysis (RCA), SDS compliance, near-miss reporting | LTIR, TRIR, injury frequency rate, environmental spills, lost workdays, audit findings |
Who Owns the Number | Supervisors, EHS coordinators, department managers, frontline leaders | EHS directors, safety committees, senior management, executive leadership |
Reporting Frequency | Weekly or monthly, aligned with operational activities | Monthly, quarterly, or annually, aligned with organizational reporting cycles |
Regulatory Role | Supports proactive safety management under ISO 45001 and OSHA guidance | Required for regulatory recordkeeping, compliance reporting, and performance benchmarking |
Risk if Ignored | Hazards remain unidentified until they result in incidents | Limited visibility into safety performance until harm has already occurred |
Actionability | Enables immediate corrective and preventive actions | Primarily supports trend analysis and future prevention strategies |
Timing is the most obvious difference, but it is not the only one that matters when a scorecard is being designed. Where the data comes from, who is accountable for it, and how often it gets reviewed all shape whether an indicator actually changes behavior or just sits in a report.
- Data source and ownership: leading indicators come from routine, day-to-day activity, an inspection checklist, a training record, a toolbox talk sign-in sheet, so the people closest to the work are usually the ones who own the number. Lagging indicators come from incident reports, injury logs, and citation notices, which means they tend to roll up to the EHS director or safety committee rather than to a frontline supervisor. That ownership gap matters: a metric someone is directly accountable for gets more attention than one that only shows up on a dashboard someone else watches.
- Reporting frequency: leading indicators are only useful if they are reviewed often enough to act on. A toolbox talk completion rate checked weekly can catch a slipping site before the quarter ends. Lagging indicators, by contrast, are usually reported monthly, quarterly, or annually because that is the cadence regulators and boards expect, not because that is the cadence that helps prevent the next incident.
- Who the metric is built for: leading indicators are built for the people running daily operations, supervisors, EHS coordinators, and site managers who need to know where to focus this week. Lagging indicators are built for the audiences who need a historical record: auditors, insurers, regulators, and boards reviewing annual performance.
- What happens if each is ignored: ignore leading indicators and hazards keep accumulating unnoticed until they eventually surface as an incident. Ignore lagging indicators and an organization loses its ability to benchmark against peers, satisfy regulatory recordkeeping, or demonstrate compliance during an audit. Neither failure mode is acceptable on its own, which is exactly why a scorecard needs both.
The practical takeaway is that leading and lagging indicators are not interchangeable substitutes for each other; they answer different questions for different audiences on different timelines. A scorecard that only reports one type is only answering half the question a safety program actually needs answered.
Why Lagging Indicators Alone Are Risky
A scorecard built only on lagging indicators can look strong for reasons that have nothing to do with an actually safe workplace.
- Low incident rates can mask underreporting or complacency. A falling injury rate gets celebrated as progress, but it can just as easily mean workers have stopped reporting minor injuries and near miss, out of pressure to keep production moving, fear of being blamed, or an incentive program that quietly punishes honesty. Without leading indicators to check the health of the reporting culture itself, a good-looking lagging trend can hide a growing problem instead of confirming there isn’t one.
- Regulatory expectations have moved toward proactive hazard identification. ISO 45001, the international standard for occupational health and safety management systems, builds proactive hazard identification and risk assessment into the core requirements of the management system rather than treating incident counts as the main proof of a program’s maturity. Organizations certified to it need to show hazards are being found and controlled before they cause harm, not just that harm is being tracked afterward.
- OSHA has been pushing employers past injury rates alone. OSHA’s guidance on leading indicators encourages employers to look past injury and illness rates as the only yardstick for safety performance, pointing to things like management commitment, worker participation, and hazard identification as more useful measures of how a program is actually functioning. Recordkeeping still runs on lagging data, but the broader regulatory conversation has clearly shifted toward valuing the proactive side too.
A scorecard built only on lagging data is, by design, always looking backward. It can tell you a program failed. It cannot tell you where the next failure is likely to show up.
How EHS Software Connects Leading and Lagging Indicators in EHS Performance
Most organizations already collect plenty of data. The harder problem is connecting leading activity to lagging outcomes quickly enough to act on it, instead of discovering the link months later during an annual review. EHS software that brings both metric types into one system turns them from separate reports into a single, correlated view of risk.
- Dashboards that plot leading activity against lagging outcomes: instead of reviewing inspection completion and injury rates in two separate quarterly reports, a connected dashboard tracks both together, so a site with slipping inspection closure rates and a rising trickle of near miss reports stands out weeks before anything becomes a recordable injury.
- Risk advisory tools that flag patterns before they cause harm: models trained on past incident, inspection, and observation records can flag combinations, a particular shift pattern, contractor mix, or task type, that have preceded incidents before, giving safety managers a shortlist of where to look first.
- Automated CAPA, observation, and inspection data in one place: when corrective action tracking, observations, and inspection findings all land in the same system automatically, safety leaders stop reconciling spreadsheets from different sites by hand, and leading-indicator data stops going stale from the friction of manual reporting.
- Modules that tie the metrics to day-to-day work: Observation Reporting, Inspection Management, Risk Assessment and Job Hazard Analysis (JHA), and AI Risk Advisory work inside one platform, so the supervisor logging a toolbox talk and the technician closing an inspection finding are feeding the same system that reports lagging outcomes to leadership. That is what actually closes the loop between frontline activity and the numbers a director sees.
Building a Balanced EHS Scorecard for leading and lagging Indicators In EHS Performance
A balanced scorecard needs to show both the health of the proactive work and the outcomes that work is meant to prevent. A few practices make that possible:
- Pair metrics on purpose: for every lagging metric on the scorecard, LTIR, spill frequency, or near miss counts, for example, put a leading metric next to it that plausibly drives it, such as inspection closure rate or SDS compliance.
- Give leading indicators their own targets: leading metrics need targets and an accountable owner, not just a passing mention whenever a lagging number moves.
- Review both at the same meeting, side by side: when leadership safety reviews present leading and lagging data together rather than in separate sections, it signals that both actually count toward performance.
- Normalize the numbers across sites: raw counts across facilities of different sizes distort comparisons; normalizing per headcount, hours worked, or task volume makes benchmarking meaningful.
- Look at trend lines, not single months: one month’s inspection completion rate says almost nothing on its own. The trajectory over several quarters is what actually shows whether a program is maturing.
Common Pitfalls in Indicator Programs
Even a well-designed indicator program can lose its value if these issues go unchecked.
- Tracking too many metrics at once: trying to measure every leading and lagging indicator simultaneously spreads attention thin and makes it hard for teams to tell which numbers actually drive decisions.
- Treating leading indicators as boxes to check: when training completion or inspection frequency becomes a target people game rather than genuinely pursue, the data stops predicting anything, even if it looks strong in a report.
- Never closing the loop on corrective actions: finding a hazard through an inspection or observation and then leaving the fix open indefinitely defeats the point of tracking leading indicators in the first place.
- Keeping data siloed across departments: when safety, environmental, and quality data live in separate spreadsheets or systems, correlating leading activity with lagging outcomes turns into a manual exercise that rarely gets done consistently enough to matter.
- Cutting back once lagging numbers improve: some organizations scale back inspections, training, or audits once injury rates fall, without recognizing that the drop in injuries was likely a result of the very activity now being cut.
- Ignoring the quality of near miss and observation data: a high volume of near miss reports means little if the reports themselves are vague and cannot actually be traced back to a root cause or a pattern.
Conclusion: Balancing Leading and Lagging Indicators in EHS Performance
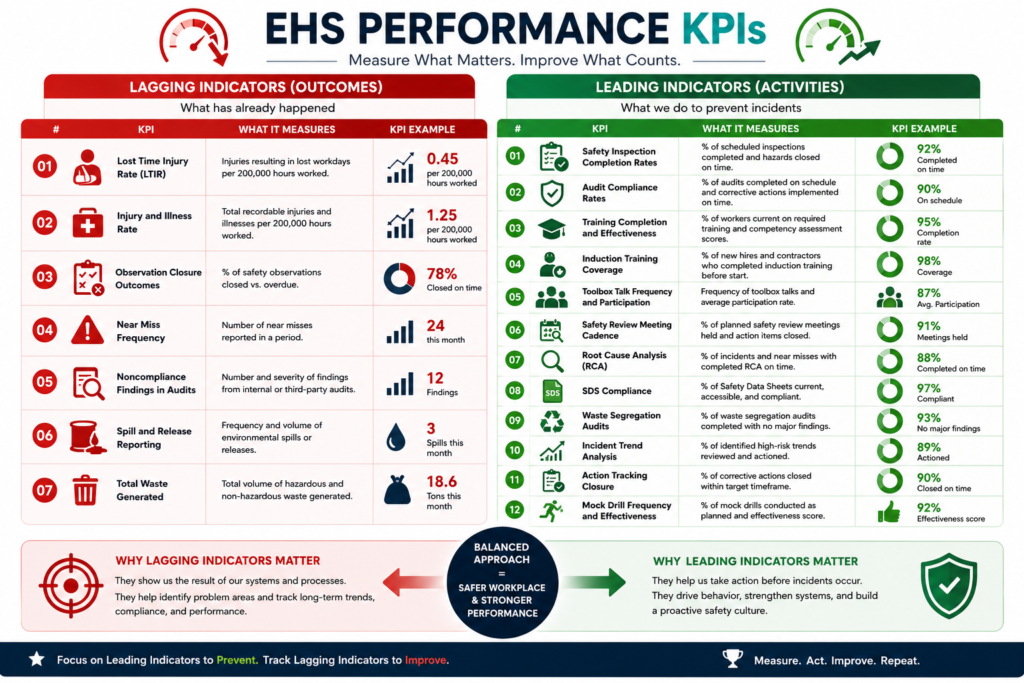
Leading and lagging indicators in EHS performance work best as two halves of the same system, not as competing frameworks. Lagging indicators confirm what already happened and remain essential for regulatory reporting and long-term benchmarking. Leading indicators give safety teams the visibility to step in before an incident occurs. Organizations that lean on lagging data alone risk being caught off guard by underreporting, complacency, or a widening gap with regulatory expectations, especially as ISO 45001 and OSHA guidance keep pushing toward proactive hazard management.
A scorecard built only on lagging data can only confirm failure after the fact, while a scorecard built only on leading data has no way to validate that the activity is actually reducing harm, which is why both are needed to see the full picture. The organizations that manage risk well treat leading and lagging indicators, including near miss data, as linked rather than as separate reports filed away in different folders, and they build that connection deliberately: pairing metrics, assigning ownership, reviewing both at the same cadence, and normalizing data across sites so that a list of numbers turns into a program that actually drives decisions. Just as important is staying alert to the pitfalls that quietly erode a program over time, checkbox thinking, siloed data, and scaling back once numbers improve are the most common ways an otherwise well-designed indicator program loses its value.
EHS software makes this connection practical on a daily basis, linking real-time leading activity to lagging outcome trends, surfacing patterns worth a closer look, and pulling observation, inspection, and CAPA data into a single place. Mature platforms take this further, giving organizations a structured way to record both leading and lagging indicators together and keep KPIs consistently on target, rather than leaving that tracking to scattered spreadsheets and year-end reconciliation. That connection, more than any single metric, is what moves a safety program from reactive compliance toward genuine prevention.